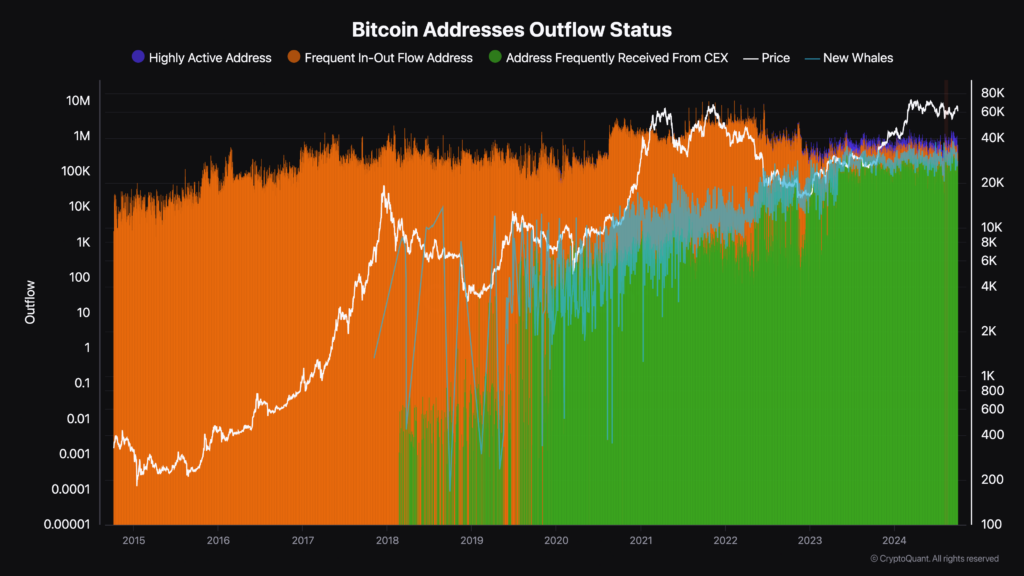
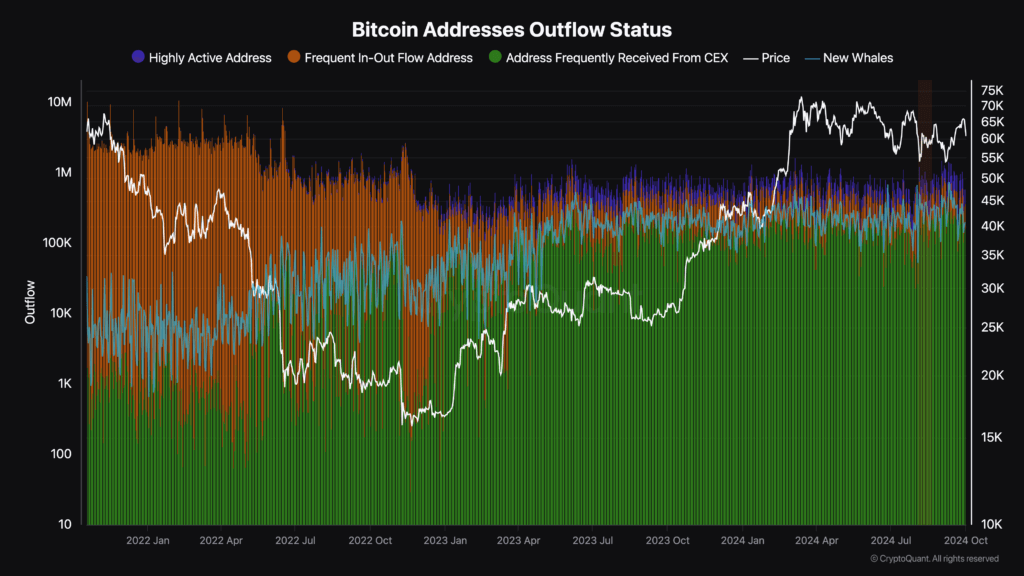
Analysis of Bitcoin address outflow patterns indicates a correlation between address activity types and Bitcoin’s price movements from 2014 to 2024. Per CryptoQuant data, shifts in outflow trends among different address categories reflect underlying market trends and participant behaviors.

From 2014 to 2017, frequent in-out flow addresses dominated Bitcoin’s outflow landscape. This period coincided with low Bitcoin prices relative to today, suggesting that high transactional activity among these addresses did not significantly impact market valuation. The dominance of frequent in-out flows mirrors a market primarily driven by smaller transactions and individual users engaging in regular transfers.
Around 2018, a notable shift occurred as addresses frequently receiving from centralized exchanges began to grow rapidly. This growth came with an increase in Bitcoin held by or moving through exchange addresses due to heightened trading activity and increased user adoption of exchanges.
The timing aligns with an upward trend in Bitcoin’s price, indicating a connection between exchange activity and market valuation. The prominence of exchange-related addresses may echo investors moving assets onto exchanges in anticipation of market movements or increased speculative trading.
The number of new whale addresses identified by new or existing large Bitcoin holders spiked at the beginning of 2020. The spike coincided with increased Bitcoin price growth and volatility, implying accumulation regardless of the price.
The influx of new whales during these periods suggests that institutional investors or high-net-worth individuals were entering the market, potentially driving prices upward through substantial purchases.
Bitcoin address activity from 2021 onward
As Bitcoin’s price declined throughout 2022, frequent in-out flow addresses remained dominant. However, their influence weakened after mid-2022, coinciding with a marked increase in addresses frequently receiving from centralized exchanges. This shift suggests that more Bitcoin was moving through or held by exchange addresses during the recovery period, indicating increased trading activity or investor repositioning in response to market conditions.
New whale activity continued to increase during the second half of 2022 and into 2023, indicating persistent purchases by large holders during price lows. This growth reflects strategic market repositioning during periods of heightened market uncertainty. This activity correlates with Bitcoin’s price bottoming out in 2022, followed by a recovery throughout 2023 and into 2024.

The increase in new whales during periods of lower prices suggests bullish sentiment, hoping to capitalize on future price recoveries.
Since 2023, highly active addresses have gained traction for the first time in Bitcoin’s history. The development of trading bots, high-frequency trading, and Bitcoin meta layers are partially responsible. The increase in these types of addresses showcases Bitcoin’s evolution in usage and detracts from theories that Bitcoin is becoming nothing more than a store of value. Bitcoin has core utility around the world, and it is growing.
Persistent trends in Bitcoin addresses
The prominence of exchange-related addresses during specific periods reflects changes in investor behavior, such as shifts toward holding assets on exchanges for liquidity or increased trading activity in response to market volatility. Similarly, the timing of whale activity suggests that large holders influence market trends or respond strategically to price movements.
The patterns observed suggest that large holders play a significant role in market stabilization or trend reversals. Their increased activity during price lows provides support to the market, potentially preventing further declines. Conversely, periods of reduced whale activity could coincide with market uncertainty or consolidation phases.
By monitoring the flow of Bitcoin across different address categories, we can identify emerging trends or shifts in market sentiment. For example, a surge in exchange-related addresses might signal increased trading activity or anticipation of market movements, while heightened whale activity could indicate confidence among large investors in future price appreciation.
The correlation between address activity and price movements emphasizes the transparency inherent in Bitcoin. Publicly available on-chain data allows for comprehensive analysis of market behaviors, offering insight not typically available in traditional financial markets. This transparency empowers participants to make more informed decisions based on observable patterns in the network’s transactional activity.
Ultimately, analyzing Bitcoin address outflow patterns over the past decade reveals significant correlations with market cycles and price movements. The evolving trends among different address categories echo changes in market structure, participant behavior, and broader adoption trends.
The post Ten years of Bitcoin address data uncovers investor behaviors and market shifts appeared first on CryptoSlate.
 Bitcoin
  Ethereum
  Tether
  XRP
XRP  USDC
USDC  Solana
  JUSD
JUSD  TRON
TRON  Lido Staked Ether
  Dogecoin
  Figure Heloc
  Cardano
  Wrapped stETH
  Bitcoin Cash
  WhiteBIT Coin
  Wrapped Bitcoin
  USDS
USDS  Binance Bridged USDT (BNB Smart Chain)
  Wrapped eETH
  LEO Token
  Monero
  Chainlink
  Hyperliquid
  Coinbase Wrapped BTC
  Ethena USDe
  Canton
  Stellar
  WETH
WETH  Zcash
Zcash  USD1
USD1  Litecoin
  Sui
Sui  Avalanche
  USDT0
USDT0  Dai
Dai  sUSDS
sUSDS  Shiba Inu
  Hedera
  World Liberty Financial
  Ethena Staked USDe
  PayPal USD
  Toncoin
  Cronos
  Rain
Rain  Polkadot
  Uniswap
  Tether Gold
  Mantle


