Decentralized ledger platform Hedera has posted a solid set of third quarter (Q3) results, in line with broader market trends as the digital asset landscape enters a potentially transformative fourth quarter, providing insights into the future of its native token, HBAR.
Hedera Achieves Record Revenue In Q3 Despite Price Corrections
Delving into the data, Hedera’s circulating market capitalization fell 21% quarter-over-quarter (QoQ) to $2.2 billion in Q3. This decline followed notable performances earlier in the year, dropping HBAR’s market rank from 30th to 46th among all cryptocurrencies.
The circulating supply of HBAR also saw a slight increase of 5%, totaling 37.6 billion HBAR. The HBAR price dipped by 20%, decreasing from $0.08 to $0.06, reflecting market volatility and challenges the broader crypto sector faced during the period.
Related Reading
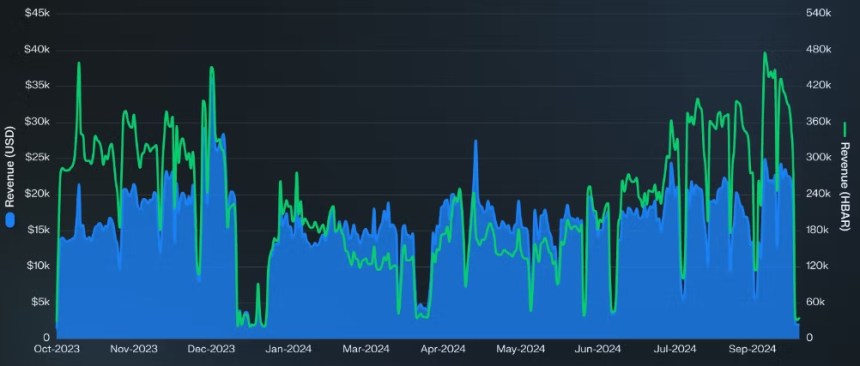
Despite the price corrections, Hedera achieved substantial revenue milestones. Revenue generated from network transaction fees reached an all-time high of 27.0 million HBAR in Q3, marking an 85% increase from the previous quarter and surpassing the prior record set in Q4 2023.

The dollar-denominated revenue also rose by 10% QoQ to $1.6 million, making the third quarter of 2024 the second-highest quarter for revenue in USD, just shy of its all-time high. Hedera’s Consensus Service was a significant contributor, with revenue increasing by 94% QoQ, accounting for 89% of the network’s total revenue.
Total Value Locked In HBAR Rises 9%
Staking activity also remained robust, with 22.3 billion HBAR staked, representing 59% of the circulating supply. This high staking percentage is attributed to entities like Hashgraph that actively participate in network consensus while forgoing staking rewards.
However, both daily average new accounts and active accounts saw declines of 22% and 23%, respectively, indicating a potential slowdown in user acquisition.
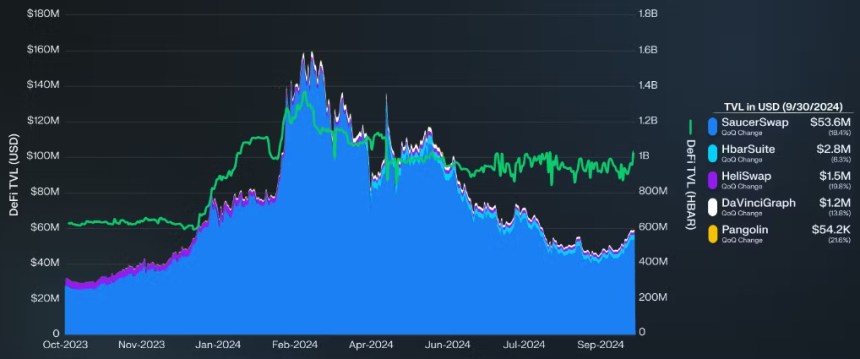
On the operational front, daily average contracts increased by 24%, driven by spikes throughout September. In the decentralized finance (DeFi) space, while total value locked (TVL) in USD dropped 18% QoQ, the TVL in HBAR rose 9%, suggesting that the decline in USD value was primarily due to HBAR’s price depreciation rather than capital outflows.

As the network prepares for Q4, Messari forecasts an increase in circulating supply by approximately 287 million HBAR, primarily aimed at fostering ecosystem development and supporting open-source projects.
HBAR Price Outlook
HBAR, currently trading at $0.069, has shown relatively flat price action as it enters the fourth quarter, especially when compared to major digital assets like Bitcoin (BTC) and Ethereum (ETH).
Over the past week, Bitcoin has gained 24%, while Ethereum has surged by 31%. In contrast, HBAR has seen a more modest increase of 17%.
Despite this recent uptick, HBAR remains 90% below its all-time high of $0.5692 reached in September 2021. This stark contrast becomes more pronounced as Bitcoin achieves new all-time highs for four consecutive days and Ethereum approaches its peak.
Related Reading
Looking forward, HBAR faces three critical resistance levels that could hinder its upward momentum as the broader market appears ready to push higher.
Having recently broken out of a consolidation phase between $0.047 and $0.062, HBAR’s first major resistance is at $0.078, a level that has acted as a barrier for the past four months.
Should the Hedera token overcome this initial hurdle, it will then encounter additional resistance at $0.092 and $0.118, corresponding to the six-month and eight-month resistance levels, respectively.
If HBAR can maintain its upward trajectory and break through these key resistance points, it may inch closer to its previous all-time highs, especially if the gains seen in key metrics in Q3 continue and translate into further price action.
Featured image from DALL-E, chart from TradingView.com
 Bitcoin
  Ethereum
  Tether
  XRP
XRP  USDC
USDC  JUSD
JUSD  TRON
TRON  Lido Staked Ether
  Dogecoin
  Figure Heloc
  Cardano
  Wrapped stETH
  Bitcoin Cash
  WhiteBIT Coin
  Wrapped Bitcoin
  USDS
USDS  Binance Bridged USDT (BNB Smart Chain)
  Wrapped eETH
  LEO Token
  Monero
  Chainlink
  Hyperliquid
  Coinbase Wrapped BTC
  Ethena USDe
  Canton
  Stellar
  WETH
WETH  Zcash
Zcash  USD1
USD1  Litecoin
  Sui
Sui  Avalanche
  USDT0
USDT0  Dai
Dai  sUSDS
sUSDS  Shiba Inu
  Hedera
  World Liberty Financial
  Ethena Staked USDe
  PayPal USD
  Toncoin
  Cronos
  Rain
Rain  Polkadot
  Uniswap
  Tether Gold
  Mantle
  MemeCore


