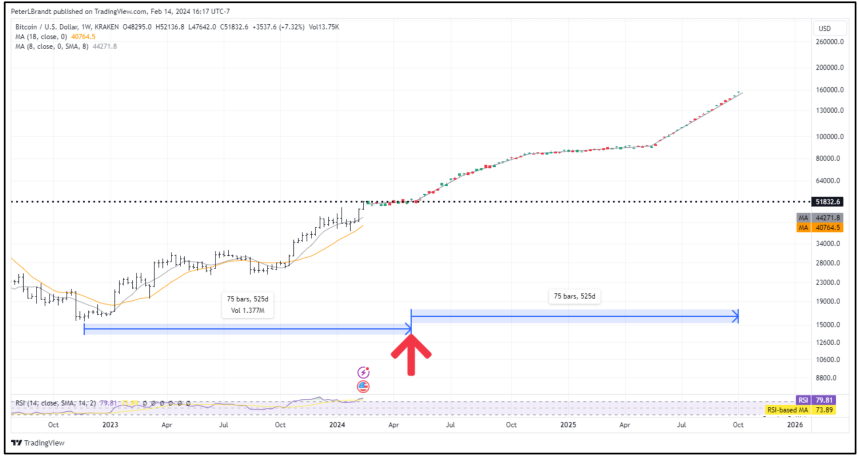
Peter Brandt, a respected figure in the trading community, has recently shared his insights on the Bitcoin future price potential. Through a post on X, Brandt ignited discussions within the crypto community by commenting on Bitcoin’s recent attainment of a new all-time high (ATH). More interestingly, he proposed when Bitcoin might scale new historic price heights.
Drawing from his experience in market analysis, Brandt speculated that Bitcoin could reach a price mark of $150,000 per BTC by October 2025, a prediction based on an in-depth analysis of Bitcoin’s price behaviour surrounding its halving cycles.
When Bitcoin has a sudden and sharp shake-out decline, the market is just winking at you $BTChttps://t.co/Qip2tQ5h44 pic.twitter.com/KSbGYvTFlW
— Peter Brandt (@PeterLBrandt) March 6, 2024
A Bullish Bitcoin Horizon
Brandt’s analysis, published in a document, delves into Bitcoin’s price patterns before and after its previous halvings. He suggests that, should the bull trend post-April 2024 mirror the pace observed since the November 2022 low, approaching the $150,000 milestone could be a likely scenario.
However, Brandt cautions that the trajectory of post-halving price advances has historically been “steeper” than their pre-halving counterparts. Brandt noted:
If the pace of the bull trend after Apr 2024 is at similar pace to the bull trend since the Nov 2022 low, then the high in Oct 2025 could be around $150,000. However, the post-halving advances during previous bull cycles have been much steeper than the pre-halving advances.

Aside from Brandt’s predictions, the bullish sentiment on Bitcoin’s price is gaining momentum among various market analysts. Insights from Deribit and the analytics company GenesisVol suggest a potential rise of as much as 20.8% in Bitcoin’s price over the next month.
These analyses suggest the possibility of Bitcoin surpassing the $80,000 threshold, with more cautious predictions still expecting it to exceed $70,000.
This optimism follows a period of notable performance for Bitcoin. So far, Bitcoin has seen a minor 0.5% dip in the last 24 hours after dropping drastically from its newly established ATH of $69,328.
However, despite this decline, the asset has been up nearly 10% over the past week, maintaining its market capitalization above the $1 trillion mark.
Market Corrections: A Natural Part Of The Crypto Journey
Commenting on the dramatic drop in BTC after creating a new ATH, Alex Thorn, Head of Research at Galaxy Digital, provided insights, emphasizing that market corrections are common even within bull markets.
Thorn also highlighted the potential benefits of market consolidation following significant gains, suggesting that a pullback could be conducive to Bitcoin’s long-term health.
by my count, #bitcoin had 13 corrections of 10% or more between the mar. 12, 2020 covid-low ($3858) and the apr. 14, 2021 ATH ($64,899) pic.twitter.com/SovuXHzS5p
— Alex Thorn (@intangiblecoins) March 5, 2024
Featured image from Unsplash, Chart from TradingView
Disclaimer: The article is provided for educational purposes only. It does not represent the opinions of NewsBTC on whether to buy, sell or hold any investments and naturally investing carries risks. You are advised to conduct your own research before making any investment decisions. Use information provided on this website entirely at your own risk.
 Bitcoin
  Ethereum
  Tether
  XRP
XRP  USDC
USDC  Wrapped SOL
  Lido Staked Ether
  TRON
TRON  Dogecoin
  Cardano
  Figure Heloc
  WhiteBIT Coin
  Wrapped stETH
  Bitcoin Cash
  Wrapped Bitcoin
  USDS
USDS  Chainlink
  Wrapped eETH
  Binance Bridged USDT (BNB Smart Chain)
  LEO Token
  Hyperliquid
  WETH
WETH  Stellar
  Monero
  Zcash
Zcash  Coinbase Wrapped BTC
  Ethena USDe
  Litecoin
  Sui
Sui  Avalanche
  Hedera
  Shiba Inu
  sUSDS
sUSDS  USDT0
USDT0  Mantle
  Dai
Dai  Toncoin
  World Liberty Financial
  PayPal USD
  Cronos
  Uniswap
  Ethena Staked USDe
  Polkadot
  MemeCore
  Aave
Aave  Bittensor
  USD1
USD1  Canton


