As Bitcoin hovers near its all-time high, industry experts and investors are keenly watching for signs of its next major move. Alex Thorn, the Head of Research at Galaxy, recently shared his perspective on the Bitcoin price trajectory and the factors influencing its potential breakout. In a detailed post on X (formerly Twitter), Thorn provided insights grounded in historical data and current market dynamics.
“We Will Climb the Wall of Worry,” Thorn proclaimed, setting the tone for his analysis. Bitcoin’s recent price action saw it reaching $69,324 on Coinbase on Tuesday, marking its first all-time high since November 10, 2021. This milestone came after an 846-day period of anticipation and speculation, only for the price to retract 14.3% to an intraday low of $59,224. This volatility, exacerbated by $400 million in long liquidations within an hour, underscores the cryptocurrency’s unpredictable nature.
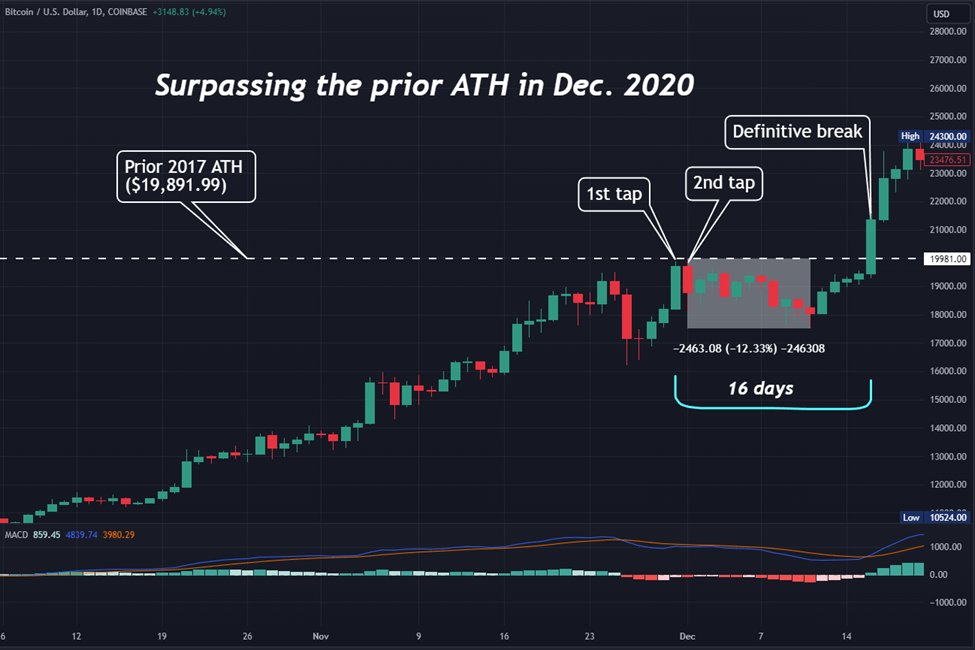
Despite the pullback, Bitcoin recovered, trading back at $67,000. Thorn remarked, “Volatility is back, and it’s likely to remain as we scale the wall of worry.” He compared the current situation to 2020 when Bitcoin first approached its then all-time high of approximately $20,000 from December 2017.
BTC faced initial resistance, experiencing a 12.33% drop after tapping the barrier twice, before ultimately surging ahead. This pattern highlights the psychological and technical challenges at previous all-time highs, a natural resistance point for any asset class. A similar (second) move could be necessary this time to shake all sellers out of the market.

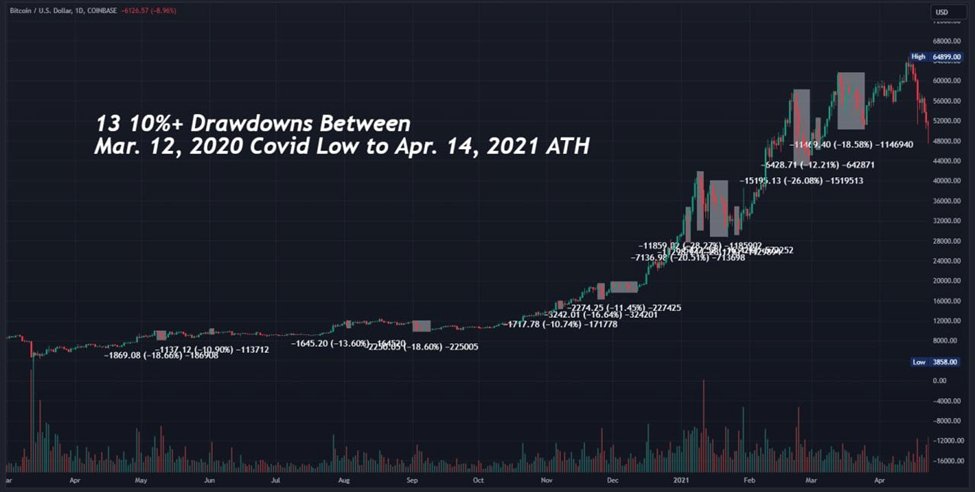
Describing the “Wall of Worry,” Thorn explained, “By my count, from Jan. 1, 2017 to the Dec. 17, 2017 all-time high of ~$20k, Bitcoin experienced 13 drawdowns of 12%+ (12 were 15%+, and 8 were 25%+). The same story played out in 2020. Between the Mar. 12, 2020 Covid low ($3858) and the Apr. 14. 2021 ATH of $64,899, there were 13 drawdowns of 10% or more (7 of them were 15% or more).”

Notably, Bitcoin already had two 15%+ retracements since the spot ETFs launched on January 11. This week was the second one, the first major drawdown was directly after the ETF launch, with price plunging roughly 20%.
Why Bitcoin Is Just Getting Started
In his analysis, Thorn also touched upon the role of ‘old coins’ or long-held Bitcoin in shaping market movements. “Some old coins did revive and probably sell, possibly helping to create the intraday top,” he explained, pointing to blockchain data that indicated movement of coins mined as far back as 2010. This shift from old to new hands is characteristic of bull markets in Bitcoin, facilitating its broader distribution and acceptance.
Highlighting the significance of market sentiment and investment flows, Thorn noted, “And Tuesday was the Bitcoin ETFs largest ever day of inflows and second largest day of net inflows (+$648m) since DAY 1.” This impressive influx of capital into Bitcoin ETFs underscores the growing interest and confidence in the cryptocurrency, even amidst volatility.
Thorn remains bullish on Bitcoin’s future, suggesting that the current price dynamics are typical of the cryptocurrency’s bull markets, known for their non-linear progression and numerous corrections. He underscored the resilience and potential for growth despite the hurdles, stating, “nothing about yesterday’s price action makes me think we aren’t going higher.”
In conclusion, Thorn’s analysis provides a nuanced view of Bitcoin’s journey towards breaking its all-time high. By comparing current events with past market behaviors, Thorn offers a compelling case for Bitcoin’s continued ascent, but after a potential phase of consolidation with several taps of the all-time high before a definitive breakout. “Buckle up, folks. We are still just getting started,” he advises.
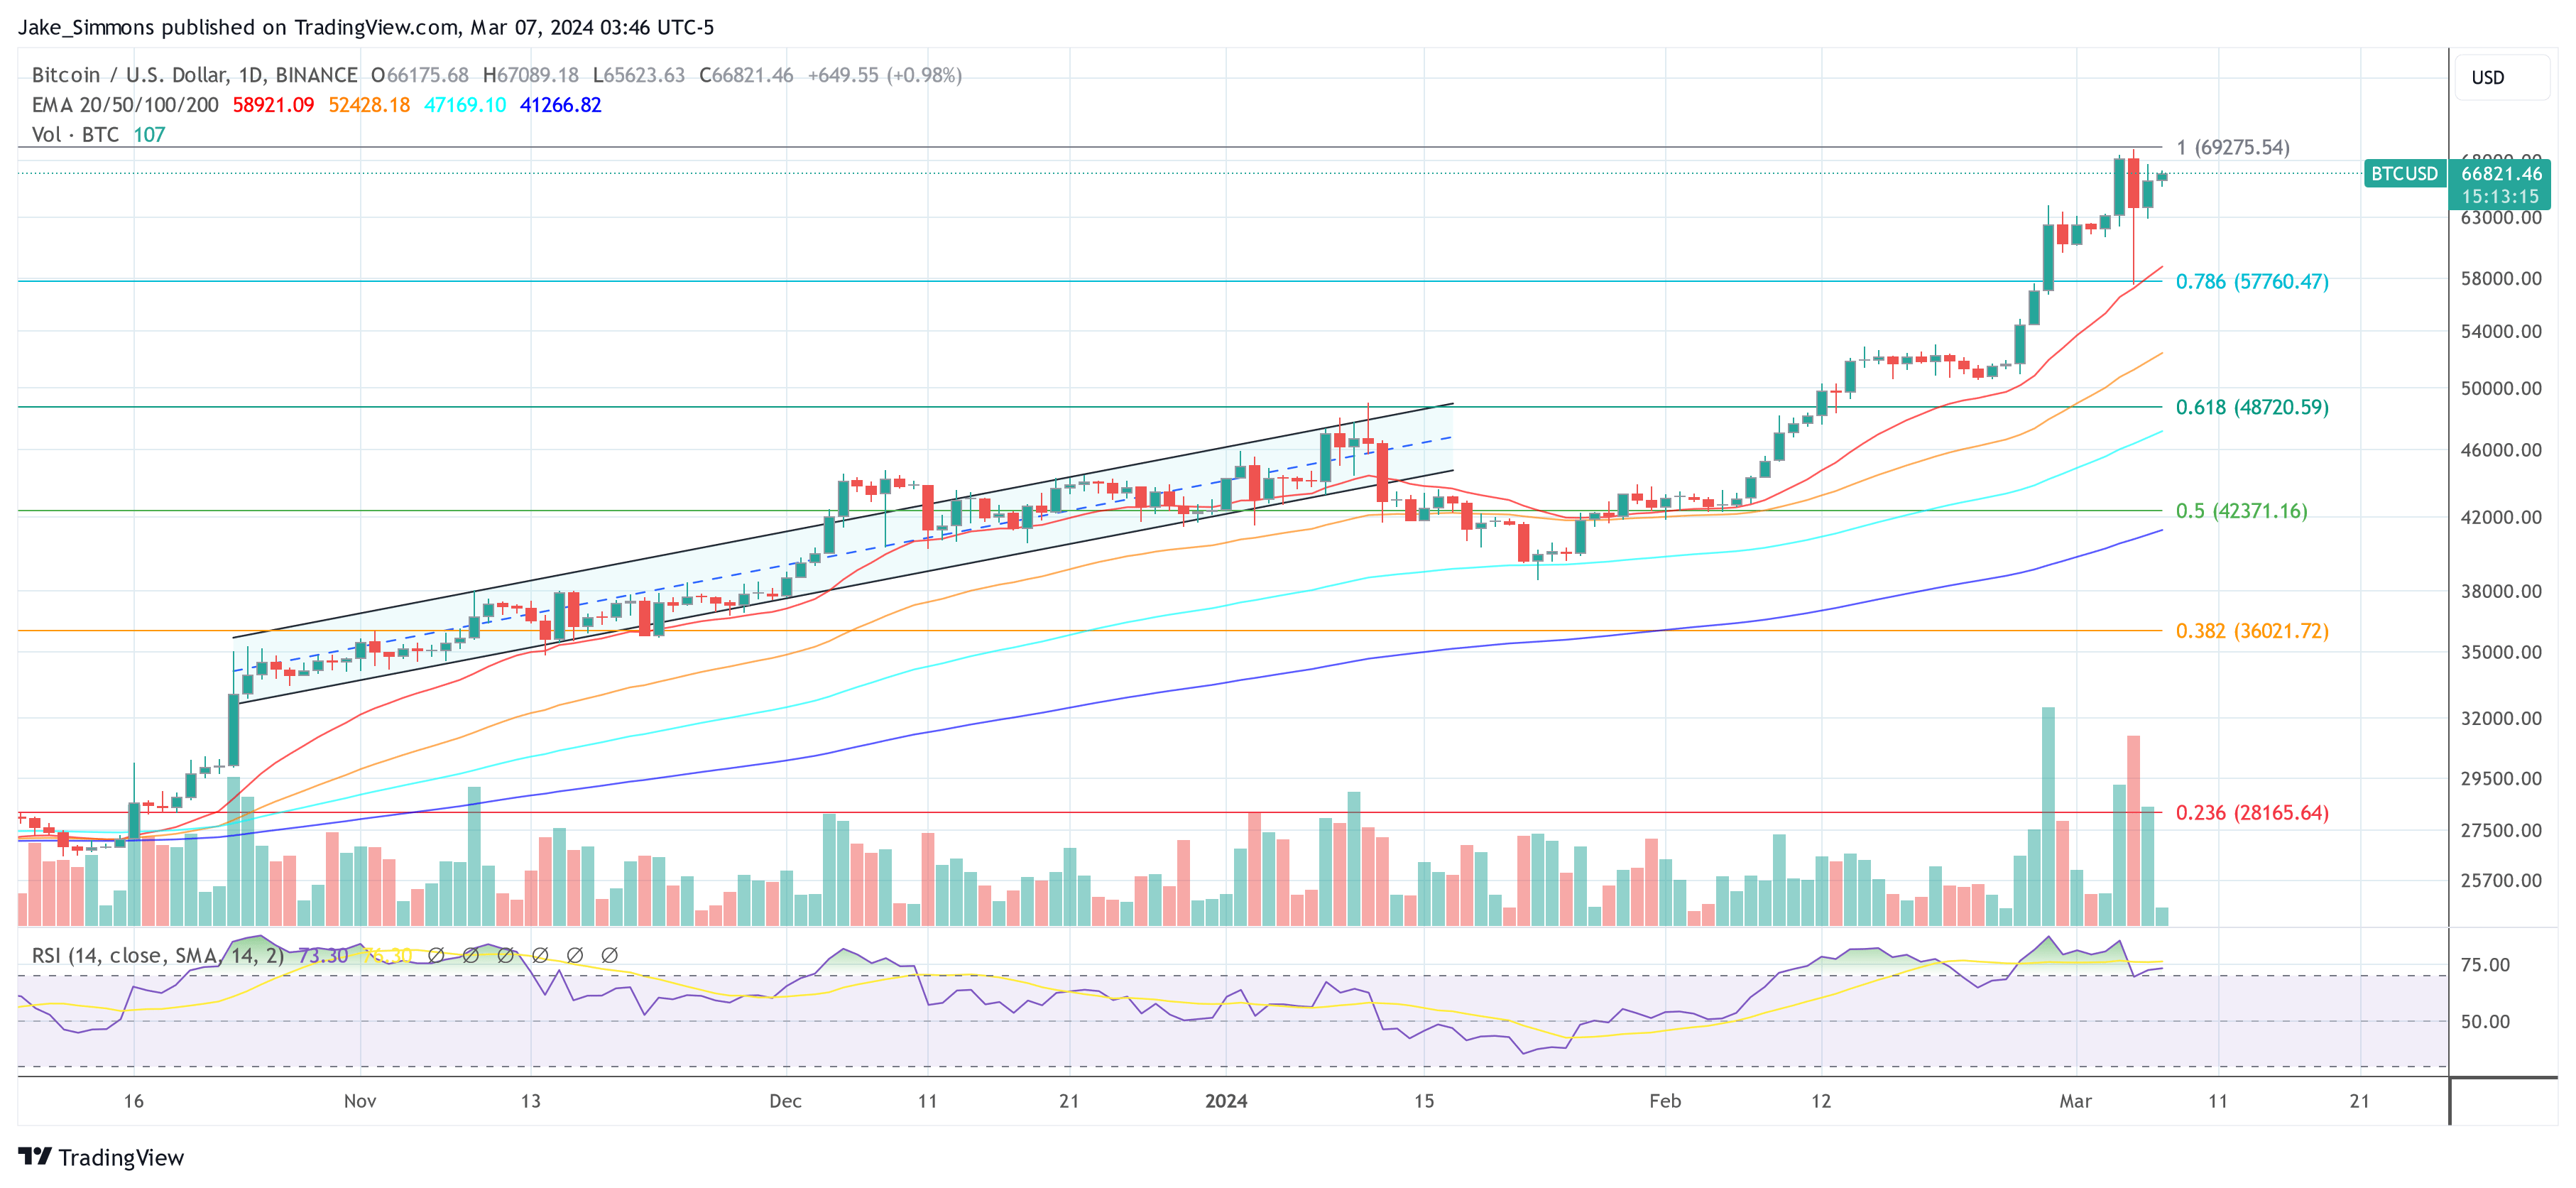
At press time, BTC stood at $66,821.

Featured image created with DALL·E, chart from TradingView.com
Disclaimer: The article is provided for educational purposes only. It does not represent the opinions of NewsBTC on whether to buy, sell or hold any investments and naturally investing carries risks. You are advised to conduct your own research before making any investment decisions. Use information provided on this website entirely at your own risk.
 Bitcoin
  Ethereum
  Tether
  XRP
XRP  USDC
USDC  Solana
  TRON
TRON  Lido Staked Ether
  Dogecoin
  Figure Heloc
  Cardano
  WhiteBIT Coin
  Bitcoin Cash
  Wrapped stETH
  Wrapped Bitcoin
  USDS
USDS  Wrapped eETH
  Binance Bridged USDT (BNB Smart Chain)
  Chainlink
  Monero
  LEO Token
  WETH
WETH  Stellar
  Zcash
Zcash  Coinbase Wrapped BTC
  Ethena USDe
  Litecoin
  Hyperliquid
  Sui
Sui  Avalanche
  sUSDS
sUSDS  Hedera
  Dai
Dai  Shiba Inu
  USDT0
USDT0  PayPal USD
  Uniswap
  Cronos
  World Liberty Financial
  Toncoin
  Mantle
  Ethena Staked USDe
  Canton
  Polkadot
  USD1
USD1  Rain
Rain  Bitget Token
  MemeCore


