Este artículo también está disponible en español.
As the week progressed, the Bitcoin (BTC) price steadily climbed toward its all-time high of $73,700 in March of this year. This upward momentum is in line with the predictions of various market experts, expecting significant gains for the leading cryptocurrency by the end of the year.
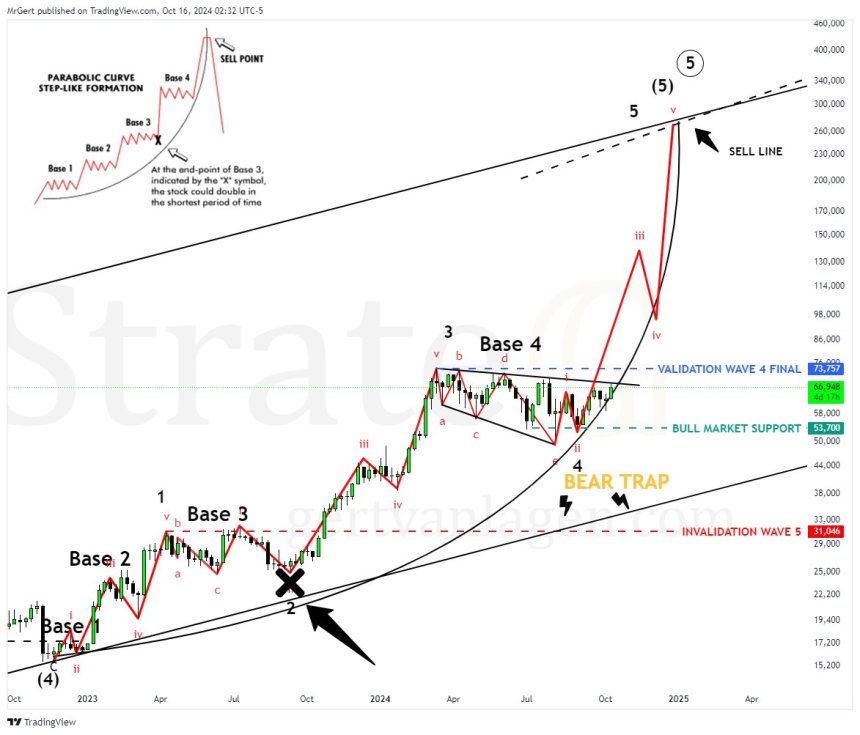
One such expert, crypto analyst Gert van Lagen, recently shared his insights on Bitcoin’s price trajectory via social media platform X (formerly Twitter). He analyzed BTC’s parabolic curve and identified a distinctive step-like formation pattern, which he believes signals a colossal wave 5 rally in the coming months.
Potential ‘Shake-Out Of The Century’
In his analysis, van Lagen presented a Bitcoin chart demonstrating that the cryptocurrency has successfully navigated several hurdles since April 2023. He categorized the price movement into three distinct phases, marking the base of the uptrend pattern that has ignited the current bullish trend.
Currently, van Lagen notes that Bitcoin’s price action is centered around base 4 of this pattern, indicating a consolidation phase between the $53,700 and $68,000 levels, with the former identified as bull market support for this cycle.
Related Reading

Van Lagen asserts that the validation of Wave 4 is imminent as Bitcoin approaches its record peak. He predicts that once Bitcoin breaks through base 4 and achieves a new all-time high, it could trigger a substantial rally in wave 5, potentially targeting prices around $250,000.
However, the analyst also warns of a significant downturn that may follow this surge. He suggests that once Bitcoin reaches the anticipated peak, a “recession” could ensue, with price targets plummeting to as low as $10,000, and in a more extreme scenario, down to $1,000. He describes this potential decline as the “shake-out of the century,” should these projections materialize.
In the medium term, the increased volatility that has characterized Bitcoin’s price over the past month has prompted the analyst to explain that if Bitcoin fails to break through the $70,000 resistance level – a barrier it has struggled with in four previous attempts – then the $57,500 level will serve as a crucial support level for the cryptocurrency.
Historical Patterns Suggest Bitcoin Price Increases Ahead
In another sign of confidence in the biggest cryptocurrency’s prospects for further gains, Blockforce Capital’s Brett Munster noted that conditions are ripe for a “perfect storm” favoring Bitcoin and other cryptocurrencies after six months of price consolidation.
Munster highlighted the role of global liquidity in this potential surge, pointing to increased capital injections from central banks worldwide. Notably, China has implemented stimulus measures to revitalize its economy.
Related Reading
Historical data suggests that when global liquidity surpasses its moving average, it often coincides with substantial price increases for Bitcoin.
In addition, optimism in the crypto market is further bolstered by a commitment from US Vice President Kamala Harris to support a regulatory framework for cryptocurrencies in response to long-standing concerns from the crypto community regarding the regulatory environment.
At the time of writing, BTC has been trading at $68,300, up 3.6% in the last 24 hours.
Featured image from DALL-E, chart from TradingView.com
 Bitcoin
  Ethereum
  Tether
  XRP
XRP  USDC
USDC  JUSD
JUSD  TRON
TRON  Lido Staked Ether
  Dogecoin
  Figure Heloc
  Cardano
  Wrapped stETH
  Bitcoin Cash
  WhiteBIT Coin
  Wrapped Bitcoin
  USDS
USDS  Wrapped eETH
  Binance Bridged USDT (BNB Smart Chain)
  LEO Token
  Monero
  Chainlink
  Hyperliquid
  Coinbase Wrapped BTC
  Ethena USDe
  Canton
  Stellar
  WETH
WETH  Zcash
Zcash  USD1
USD1  Litecoin
  Sui
Sui  Avalanche
  USDT0
USDT0  Dai
Dai  sUSDS
sUSDS  Hedera
  Shiba Inu
  World Liberty Financial
  Ethena Staked USDe
  PayPal USD
  Toncoin
  Cronos
  Rain
Rain  Polkadot
  Tether Gold
  Uniswap
  MemeCore
  Mantle


