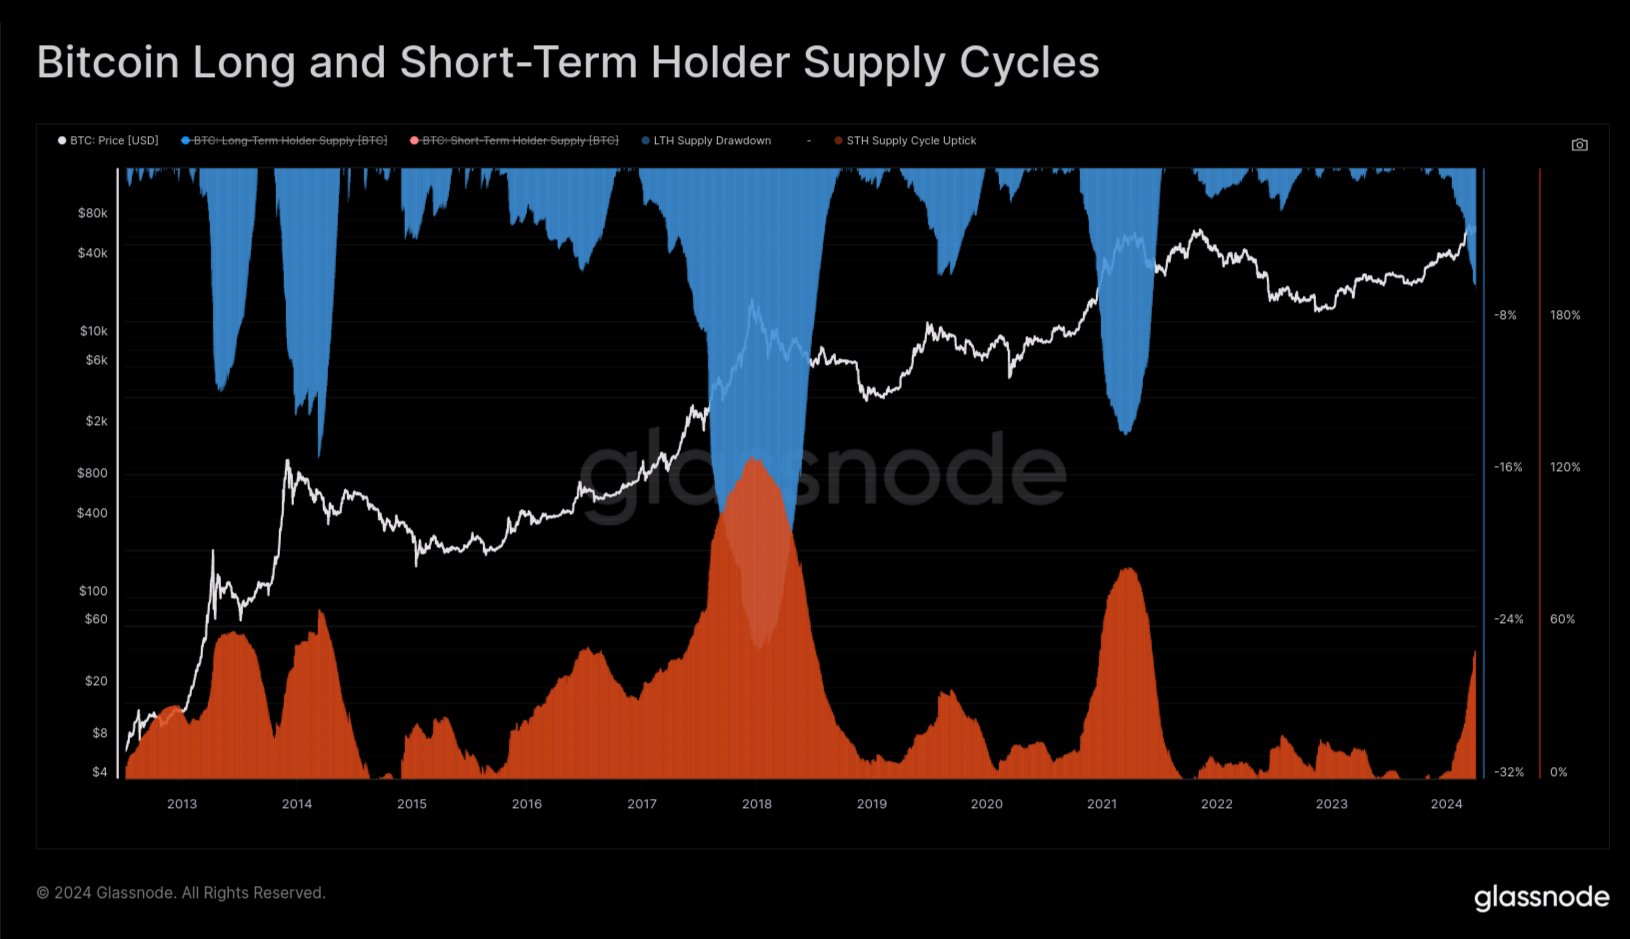
A pattern in the holdings of the Bitcoin long-term holders may suggest that the current bull run is 40% of the way to completion.
Bitcoin Long-Term Holders Have Been Distributing Recently
In a new post on X, Glassnode lead analyst Checkmate discussed the recent behavior of the long-term Bitcoin holders. The “long-term holders” (LTHs) here refer to the BTC investors who have been holding onto their coins for over six months.
Statistically, the longer an investor holds onto their coins, the less likely they become to sell them at any point. Since the LTHs hold for significant periods, they are considered quite resolute.
And indeed, they display this resilience in their behavior, rarely selling despite whatever is happening in the broader market. As such, the times they sell are all the more noteworthy.
Historically, the LTHs have taken to distribution during bull runs when the asset has broken its previous all-time high (ATH) price. Due to their long holding times, these investors amass large profits, which they start to spend when a high amount of demand comes in during bull rallies that happily take coins off their hands at high prices.
Checkmate explained that the recent ATH break of the cryptocurrency has looked similar to any other past one, with the LTHs already having started spending for this round.
The chart below shows the trend in the supply of Bitcoin LTHs over the past few years.
The value of the metric seems to have been going down in recent weeks | Source: @_Checkmatey_ on X
As displayed in the above graph, the Bitcoin LTHs have recently observed their supply heading down. Remember that when it comes to increases in this metric, there is a delay associated with when buying is happening and when this supply is going up.
This is natural because the newly bought coins must age for six months before they can be considered a part of the cohort’s holdings. When it comes to drawdowns, though, the same delay doesn’t emerge, as the age of the coins instantly resets back to zero, and they exit the group.
Thus, the latest distribution from the LTHs is indeed happening. “In the prior two cycles, new demand for Bitcoin was able to absorb this LTH sell-side for around 6-8 months while pushing prices multiples higher,” explains the Glassnode lead.
The chart below shows that the LTH supply has typically gone through a drawdown of around 14% during these bull run selloffs.
The data for the drawdown in the LTH supply over the various cycles | Source: @_Checkmatey_ on X
Checkmate notes that, based on this historical average drawdown in the LTH supply, the current Bitcoin cycle would be around 40% completion for this process.
BTC Price
Bitcoin has surged during the past 24 hours as its price has now returned to $71,800.
Looks like the price of the asset has been going up over the last few days | Source: BTCUSD on TradingView
Featured image from Shutterstock.com, Glassnode.com, checkonchain.com, chart from TradingView.com
Disclaimer: The article is provided for educational purposes only. It does not represent the opinions of NewsBTC on whether to buy, sell or hold any investments and naturally investing carries risks. You are advised to conduct your own research before making any investment decisions. Use information provided on this website entirely at your own risk.
 Bitcoin
  Ethereum
  Tether
  XRP
XRP  Solana
  USDC
USDC  TRON
TRON  Lido Staked Ether
  Dogecoin
  Figure Heloc
  Cardano
  Bitcoin Cash
  Wrapped stETH
  WhiteBIT Coin
  Wrapped Bitcoin
  Wrapped eETH
  USDS
USDS  Chainlink
  Monero
  Binance Bridged USDT (BNB Smart Chain)
  LEO Token
  WETH
WETH  Stellar
  Coinbase Wrapped BTC
  Sui
Sui  Zcash
Zcash  Ethena USDe
  Litecoin
  Avalanche
  Hyperliquid
  Canton
  Shiba Inu
  Hedera
  USDT0
USDT0  World Liberty Financial
  sUSDS
sUSDS  Toncoin
  Dai
Dai  Cronos
  Ethena Staked USDe
  PayPal USD
  Uniswap
  Polkadot
  USD1
USD1  Mantle
  Rain
Rain  MemeCore
  Bittensor


