Bitcoin’s recent market trends prompt questions about whether the early 2024 bull run has ended or if there is still potential for further growth into 2025, aligning with historical post-halving peaks. According to CryptoQuant’s Bitcoin Bull-Bear Market Cycle Indicator, Bitcoin has transitioned into a bear phase after an overheated bull period earlier this year.
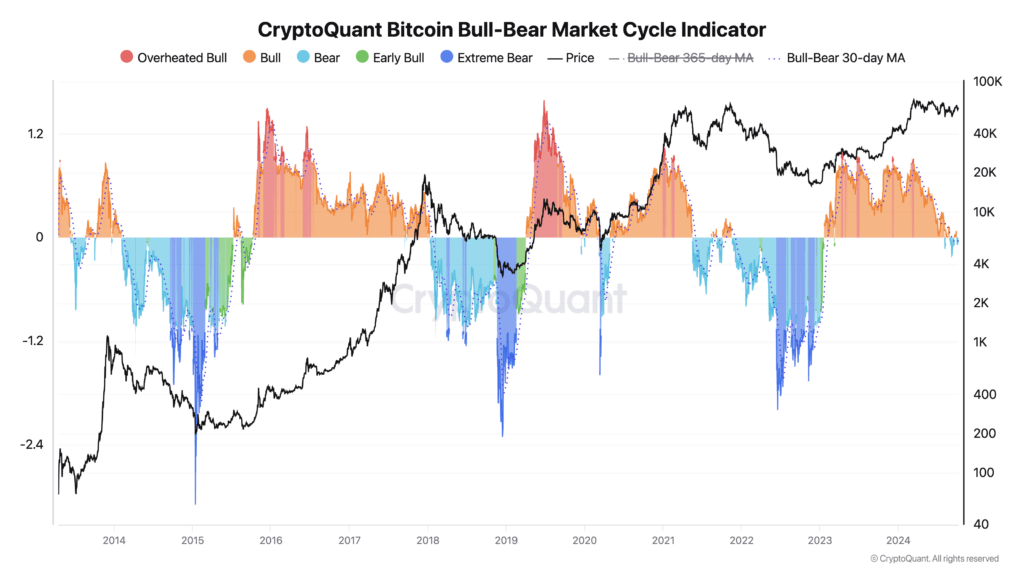
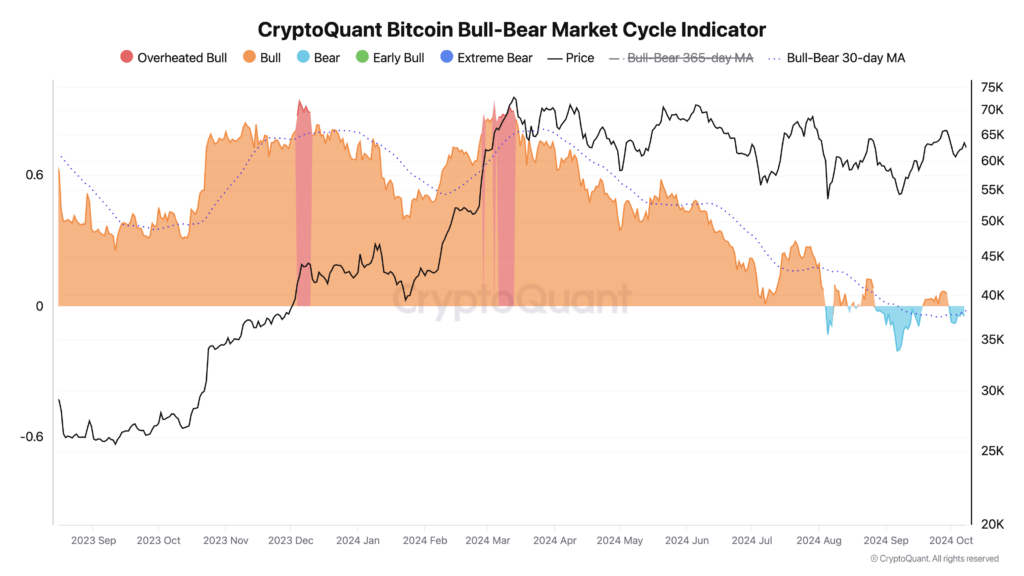
In March 2024, Bitcoin surged to an all-time high of $73,750.07, reflecting a significant peak in market optimism. This surge corresponded with an overheated bull phase, where prices significantly exceeded historical averages. Historically, Bitcoin’s bull markets reach their peaks around 500 days after a halving event, suggesting that the current cycle may not have fully matured.
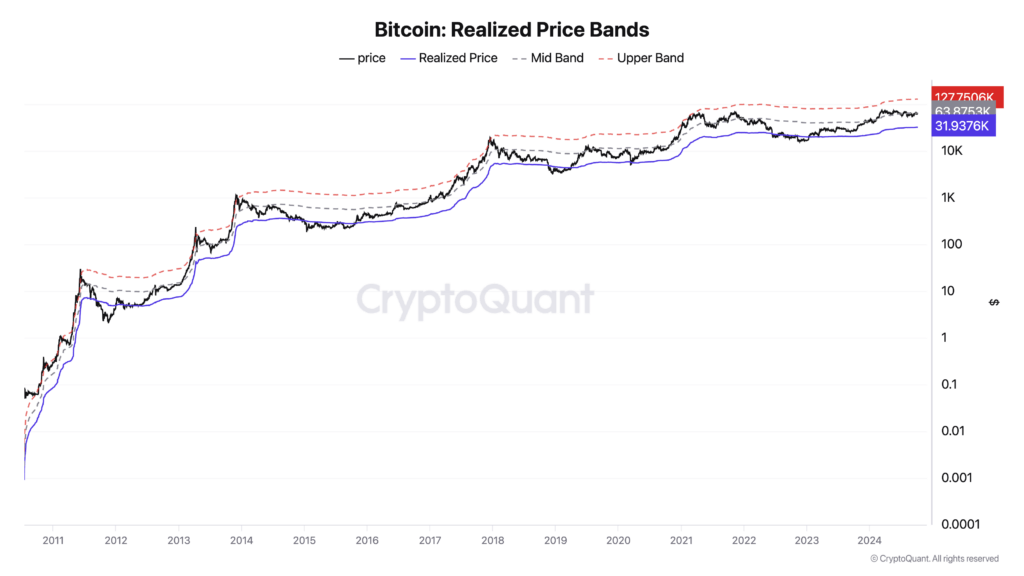
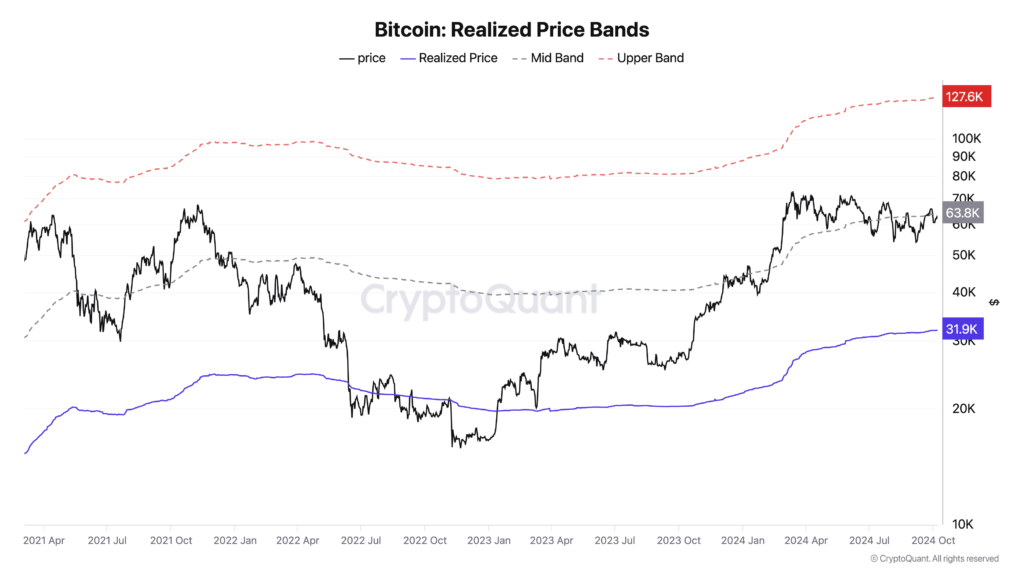
However, the realized price chart, which calculates the average price of all Bitcoins based on their last movement, indicates that Bitcoin is still around the midpoint of its cycle. In previous cycles, the realized price has risen to new highs before the market transitions into a prolonged bear phase. The current data implies that Bitcoin has yet to hit the peak typically observed in past bull markets.
Despite entering a bear phase, Bitcoin’s price remains strong compared to the beginning of the year. On Oct. 9, Bitcoin was trading at $62,151, almost doubling its value since January, when it was around $42,000. This sustained performance suggests robust market support, even amid fluctuations and cooling market sentiment.
Bitcoin market cycles are characterized by periods of rapid growth followed by corrections. The recent shift into a bear phase could signal a temporary consolidation rather than the end of the bull market. Previous cycles have exhibited similar patterns, with interim bear phases occurring before the market resumes its upward trajectory toward new peaks.
Analysts are debating whether the early 2024 peak represents the cycle’s climax or if Bitcoin will continue to rise into 2025, fitting the historical pattern of bull market tops appearing over a year after the last halving. The realized price chart supports the possibility of further growth, as the peak typically occurs after surpassing the midpoint, with the upper band currently at $127,000.
Factors such as regulatory developments, the 2024 US Election, institutional adoption, and other macroeconomic conditions could influence Bitcoin’s trajectory in the coming months. The interplay between the bear/bull market indicator and the realized price suggests that while market sentiment has cooled, underlying fundamentals may still support continued growth. Further, with Bitcoin holding strong above $60,000, it is hard to be bearish on the asset.
The key question remains whether Bitcoin will adhere to its historical cycles, with a significant peak yet to come, or if the early 2024 surge was the pinnacle for this period, bolstering fears of significantly diminishing returns.
The post Bitcoin dips into bear market zone though realized price shows room for growth to $127,000 appeared first on CryptoSlate.
 Bitcoin
  Ethereum
  Tether
  XRP
XRP  USDC
USDC  Solana
  JUSD
JUSD  TRON
TRON  Lido Staked Ether
  Dogecoin
  Figure Heloc
  Cardano
  Wrapped stETH
  Bitcoin Cash
  WhiteBIT Coin
  Wrapped Bitcoin
  USDS
USDS  Wrapped eETH
  Binance Bridged USDT (BNB Smart Chain)
  LEO Token
  Monero
  Chainlink
  Hyperliquid
  Coinbase Wrapped BTC
  Ethena USDe
  Canton
  Stellar
  WETH
WETH  Zcash
Zcash  USD1
USD1  Litecoin
  Sui
Sui  Avalanche
  USDT0
USDT0  Dai
Dai  Shiba Inu
  sUSDS
sUSDS  Hedera
  World Liberty Financial
  Ethena Staked USDe
  PayPal USD
  Toncoin
  Cronos
  Rain
Rain  Polkadot
  Uniswap
  Tether Gold
  Mantle
