Bitcoin
  Ethereum
  Tether
  BNB
BNB  XRP
XRP  USDC
USDC  JUSD
JUSD  Dogecoin
  Figure Heloc
  Cardano
  Wrapped stETH
  Bitcoin Cash
  WhiteBIT Coin
  Wrapped Bitcoin
  USDS
USDS  Wrapped eETH
  Binance Bridged USDT (BNB Smart Chain)
  LEO Token
  Hyperliquid
  Coinbase Wrapped BTC
  Ethena USDe
  Stellar
  Canton
  WETH
WETH  Zcash
Zcash  USD1
USD1  Litecoin
  Sui
Sui  Avalanche
  USDT0
USDT0  sUSDS
sUSDS  Hedera
  Shiba Inu
  World Liberty Financial
  Ethena Staked USDe
  Toncoin
  Polkadot
  Tether Gold
  MemeCore
Key Takeaways
Bitcoin may undergo a period of correction or sideways movement in the coming year.
DeFi is facing a decline in 2025 due to regulatory and scalability challenges.
CryptoQuant CEO Ki Young Ju announced that Bitcoin’s bull cycle had ended and predicted that the price would decline or move sideways for the next 6 to 12 months. Previously, he had stated that the market had not yet entered a bearish phase. So, what caused him to change his view?
The Perspective
Previously, the CEO of CryptoQuant stated that “it’s too early to call it a bear market,” and this perspective was reflected in the CryptoQuant chart.
Bitcoin Price Movements Over Different Periods
The chart shows that Bitcoin’s price (black line) has gone through several strong volatility cycles:
- 2021: Bitcoin BTC surged to its all-time high (~$69,000) in the first half of the year before experiencing a significant correction toward the end.
- 2022: The market entered a downtrend, with BTC losing over 60% of its value, reaching a bottom around $20,000.
- 2023 – 2024: Bitcoin gradually recovered, reflecting an improvement in market sentiment and new capital inflows.

Source: TradingView
“Apparent Demand” – Market Demand Indicator
The chart highlights two key color zones representing capital flow trends in the market:
- Green (Positive Apparent Demand): Indicates that BTC is being accumulated or held, reflecting a positive market sentiment.
- Red (Negative Apparent Demand): Represents BTC flowing out of the market, often signaling strong selling pressure.
The Relationship Between “Apparent Demand” and Bitcoin Price
- When the chart turns green for an extended period, Bitcoin tends to either rise or consolidate. This is a sign of accumulation, where investors believe in a long-term uptrend. Notable examples include early 2021 and late 2023.
- When the chart turns red, the market typically undergoes corrections or sharp declines. This was evident from late 2021 to mid-2022, where BTC’s price dropped significantly from $60,000 to around $20,000.
Recent Trends and Market Signals
- In 2022, Bitcoin BTC experienced one of its steepest price declines in history, coinciding with deep red zones on the chart, indicating massive selling pressure.
- Since early 2023, “Apparent Demand” has shifted back to green, signaling market accumulation. This has been one of the key factors supporting BTC’s recovery.
On-chain data suggests that the “Apparent Demand” index continues to reflect existing market demand, institutional and Bitcoin ETF inflows remain present, and BTC’s price is still holding at critical support levels.

Source: X
Ki Young Ju cited 4 main reasons for his change in outlook:
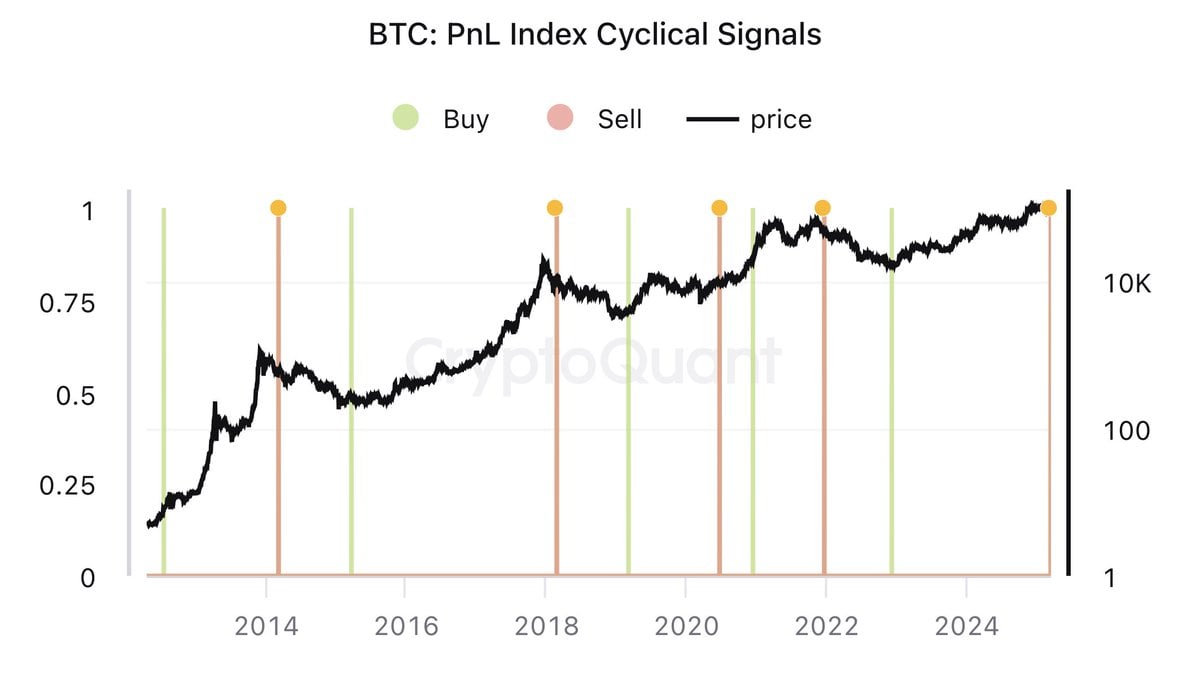
PnL Index Cyclical Signals
Chart Structure
- Black line: Represents Bitcoin’s price over time (logarithmic scale).
- Green vertical lines: Buy signals – Indicate periods when Bitcoin is considered to have strong growth potential.
- Red vertical lines: Sell signals – Warn of Bitcoin reaching a peak and a potential price correction.
- Yellow dots: Peaks based on the PnL index, often signaling the extreme growth cycles of Bitcoin.
Bitcoin’s Historical Trends According to the PnL Index
The chart indicates that Bitcoin follows a clear cycle of growth and correction, as reflected in the following signals:
- 2013-2014 Cycle: Bitcoin surged significantly before a sell signal appeared around 2014, followed by a sharp market decline.
- 2017-2018 Cycle: Bitcoin reached a peak near $20,000, after which a sell signal emerged, leading to a steep price drop.
- 2021-2022 Cycle: Bitcoin hit a new all-time high above $60,000, then experienced a significant decline following a sell signal in late 2021.
- 2024-2025 Period: The chart now shows another sell signal close to the present, suggesting that Bitcoin BTC may have already peaked or is approaching the top of this cycle.
Recent Trends and Forecast
- The latest data shows a sell signal appearing in 2024-2025, similar to previous cycles.
- This indicates that the indicator has just issued a sell signal, aligning with previous peaks in 2013, 2017, and 2021. Historically, after each of these signals, BTC has experienced a correction phase lasting 6-12 months.
- While this does not necessarily confirm that Bitcoin has entered a bear market, it suggests that BTC could face a period of correction or sideways movement in the near future
Source: X
On-chain metrics signaling a bear market:
Indicators such as MVRV, SOPR, and NUPL all show a downward trend, reflecting negative market sentiment and a potential entry into a bear market.
Source: X
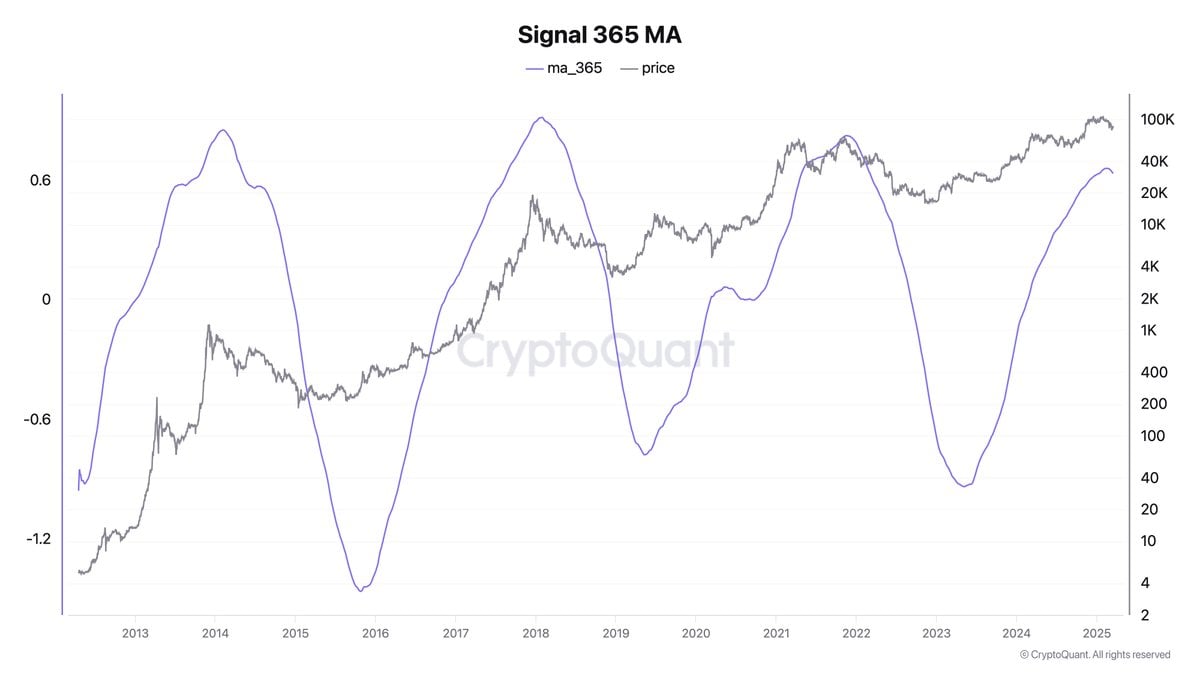
Chart Structure
- Black line: Represents Bitcoin’s price over time (logarithmic scale).
- Blue line (ma_365): The 365-day moving average calculated from on-chain data, reflecting the market’s long-term momentum.
Historical Trends and Forecast
- 2013-2014: The ma_365 index peaked, leading to Bitcoin reaching an all-time high of approximately $1,100, followed by a sharp decline in 2015.
- 2017-2018: The ma_365 index peaked again, with Bitcoin reaching an all-time high of around $20,000, before experiencing a significant drop in 2018.
- 2020-2021: The ma_365 index reached its highest level ever, coinciding with Bitcoin’s all-time high of $69,000, followed by a deep correction in 2022.
- 2024: The ma_365 index is currently rising strongly, indicating that the market is in an expansion phase, but it has not yet reached the peak levels seen in previous cycles.
Market Signals for Investors
- The MVRV Ratio (Market Value to Realized Value) is approaching a critical zone, similar to previous market peaks. This suggests that Bitcoin may be nearing an overheated phase.
- The SOPR (Spent Output Profit Ratio) indicates that many investors are selling Bitcoin at a loss, signaling a shift away from profit-taking behavior.
- The NUPL (Net Unrealized Profit/Loss) shows a decline in unrealized profits, a pattern that has historically preceded market corrections.
These indicators have appeared in past bear markets, suggesting that Bitcoin may be entering a phase of increased risk or potential market adjustment.
New liquidity drying up:
Institutional capital inflows and Bitcoin ETFs have declined, leading to a lack of liquidity to support BTC prices. For example, BlackRock’s Bitcoin ETF has recorded three consecutive weeks of outflows.
Whales selling BTC at lower prices:
Large Bitcoin holders (Whales) are offloading their BTC at lower price levels, adding downward pressure to the market.
Is Bitcoin Really Entering a Bear Market?
Based on these factors, Bitcoin BTC is facing strong downward pressure and could be entering a bear market. However, the cryptocurrency market is inherently volatile and difficult to predict. Investors should remain cautious, closely monitor key market indicators, and stay informed to make sound investment decisions.

DeFi’s Underperformance in 2025
Decentralized Finance (DeFi) was expected to be a key driver of the crypto bull cycle, providing decentralized financial services such as lending, borrowing, staking, and yield farming. However, as of early 2025, DeFi has been underperforming and has not met initial expectations. Below is a detailed analysis based on recent data and research, as of March 19, 2025.
Background and Initial Expectations
DeFi is a decentralized financial ecosystem built on blockchain technology, allowing users to conduct financial transactions without intermediaries such as banks or traditional financial institutions. During the uptrend, DeFi was expected to attract more capital through yield farming, staking, and innovative financial products.
According to Exploding Topics, in 2020, DeFi’s Total Value Locked (TVL) increased 14 times, and by 2021, TVL peaked at $112.07 billion, demonstrating its growth potential during bull markets. The expectation was that DeFi would continue to drive the next uptrend, with TVL soaring due to new capital inflows from both retail and institutional investors.
Reality: DeFi’s Underperformance
However, recent data suggests that DeFi has faced multiple challenges, leading to lower-than-expected performance. Key factors include:
Declining Total Value Locked (TVL)
TVL is a crucial indicator reflecting the health and activity of DeFi, measuring the total value of assets locked in DeFi protocols. According to DeFiLlama, in December 2024, TVL reached $140 billion, but by March 2025, it had dropped to $90 billion. This sharp decline signals decreasing liquidity and investor confidence. Possible reasons include:
- Investors withdrawing funds due to security concerns, especially following major hacks.
- The broader crypto market is undergoing a correction, affecting the value of locked assets.
Regulatory Challenges
Unclear regulatory frameworks, particularly in major markets like the U.S., have become significant barriers. AML (Anti-Money Laundering) and KYC (Know Your Customer) regulations impose compliance hurdles, discouraging large financial institutions from engaging with DeFi. This has restricted institutional capital inflows, which were expected to propel DeFi growth during the bull run.
Additionally, regulatory uncertainty in the U.S. has forced many DeFi projects to pause or adjust their strategies, slowing their overall development.
Scalability and Transaction Costs
Major blockchains like Ethereum—the primary DeFi platform—still struggle with scalability, processing only around 15 transactions per second (TPS), much slower than blockchains like Solana.
However, the Layer-2 ecosystem, including Arbitrum and Optimism, has significantly improved scalability, increasing the total TPS to around 592 as of January 2025. While this has helped accelerate transactions for DeFi applications, it has not yet fully resolved Ethereum’s limitations.
According to L2Beat, TVL on Layer-2 solutions grew by 232% in a year, surpassing $37 billion, but these solutions have not yet completely replaced the need for Ethereum mainnet transactions.
Conclusion
Bitcoin is showing signs of entering a correction phase, with on-chain indicators like PnL Index, 365 MA Signal, MVRV, SOPR, and NUPL reflecting increased selling pressure and declining liquidity. While not confirming a bear market, historical data suggests a 6-12 month period of market consolidation or decline.
At the same time, DeFi has underperformed in 2025, facing declining TVL, regulatory hurdles, security concerns, and scalability challenges. Despite the adoption of Layer-2 solutions, DeFi has yet to meet expectations as a key growth driver.
Will the market view of the CryptoQuant CEO be correct this time, and will there be any bullish waves in 2025?