Bitcoin
  Ethereum
  Tether
  XRP
XRP  BNB
BNB  Solana
  USDC
USDC  Dogecoin
  Figure Heloc
  Cardano
  Bitcoin Cash
  Wrapped stETH
  WhiteBIT Coin
  Wrapped Bitcoin
  Wrapped eETH
  USDS
USDS  Binance Bridged USDT (BNB Smart Chain)
  LEO Token
  WETH
WETH  Stellar
  Coinbase Wrapped BTC
  Sui
Sui  Ethena USDe
  Litecoin
  Zcash
Zcash  Avalanche
  Hyperliquid
  Shiba Inu
  Hedera
  Canton
  USDT0
USDT0  World Liberty Financial
  sUSDS
sUSDS  Toncoin
  Ethena Staked USDe
  Polkadot
  USD1
USD1  MemeCore
  Bittensor
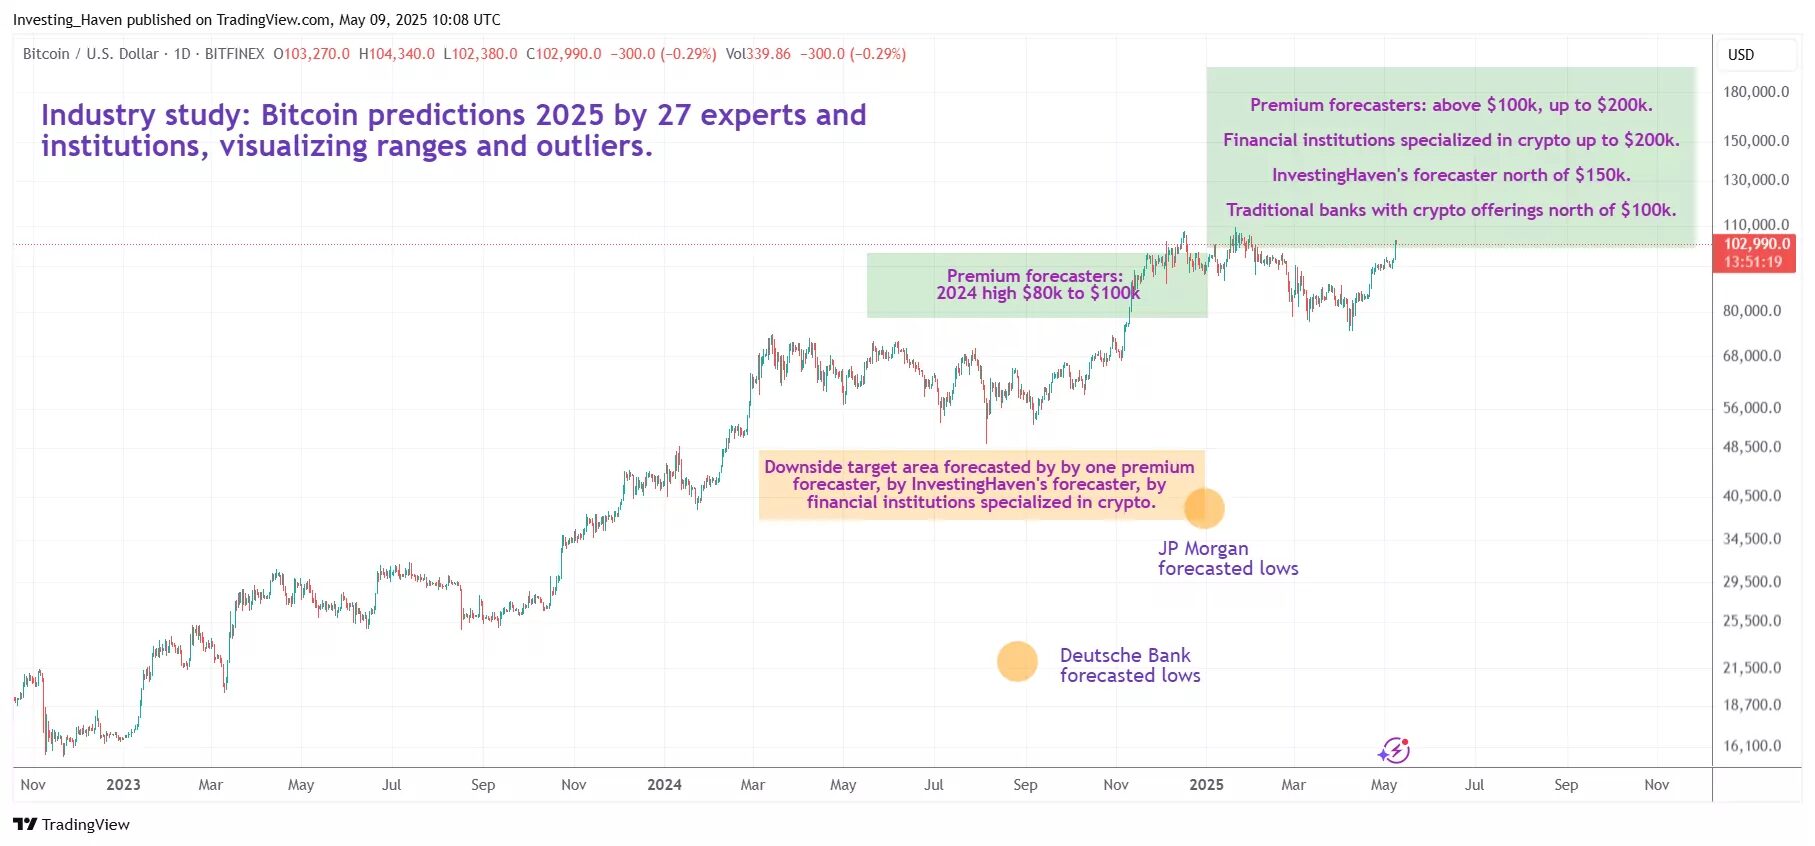
As Bitcoin BTC trades above $102,000 for the first time since March, the market is asking the most pressing question of this cycle: How high can Bitcoin go before it peaks?
With macroeconomic headwinds, ETF inflows, and halving effects in full swing, predictions range from conservative to wildly optimistic. But beyond speculation, what do institutions, chart patterns, and data actually tell us about the top of this cycle?
Institutional Views: From JPMorgan to Standard Chartered
Wall Street and crypto-native firms alike are revising their BTC forecasts upward. Earlier this year, JPMorgan released a report suggesting Bitcoin could reach $110,000 by year-end 2025, citing increasing institutional demand through spot Bitcoin ETFs and a weaker dollar environment.
Meanwhile, Standard Chartered remains one of the more bullish traditional institutions. In an April note, the bank reaffirmed its target of $150,000, stating:
“We see structural inflows into Bitcoin continuing, especially from sovereign wealth funds and pension managers now able to allocate through regulated ETF vehicles.”
On the more extreme end, Ark Invest’s Cathie Wood reiterated her long-term projection of $1 million per BTC by 2030 but also hinted that this cycle could test $200,000 if ETF inflows maintain their current pace.
According to Farside Investors, U.S. spot Bitcoin ETFs saw over $13.1 billion in net inflows since launch in January, with BlackRock’s IBIT leading the pack at over $4.8 billion. These sustained inflows, averaging more than $250 million per week – provide a robust floor for BTC and may continue fueling upside momentum.
Read more: JP Morgan: Investors Prefer Gold Over Bitcoin as a Safe-Haven
Moreover, Ki Young Ju – CEO CryptoQuant remains cautiously optimistic about Bitcoin’s outlook. He noted that while the market is currently “slow in digesting new liquidity,” the recent price movements suggest strong bullish momentum, largely driven by significant ETF inflows and easing selling pressure. However, he also emphasized that market signals remain mixed, with no clear indication yet of whether a profit-taking phase has firmly begun or not.
Read more: CryptoQuant CEO: “A New Era for Bitcoin has Begun”
On-Chain Signals: Still Room to Run?
BitcoinMagazine data from May 12, 2025, shows that long-term holders are still in distribution mode, but the magnitude is moderate compared to previous peaks in 2017 and 2021.
The Realized Cap HODL Waves metric, often used to visualize age-based distribution patterns, indicates that coins aged 3-6 months are rising, suggesting early-cycle accumulation is evolving into mid-cycle optimism.
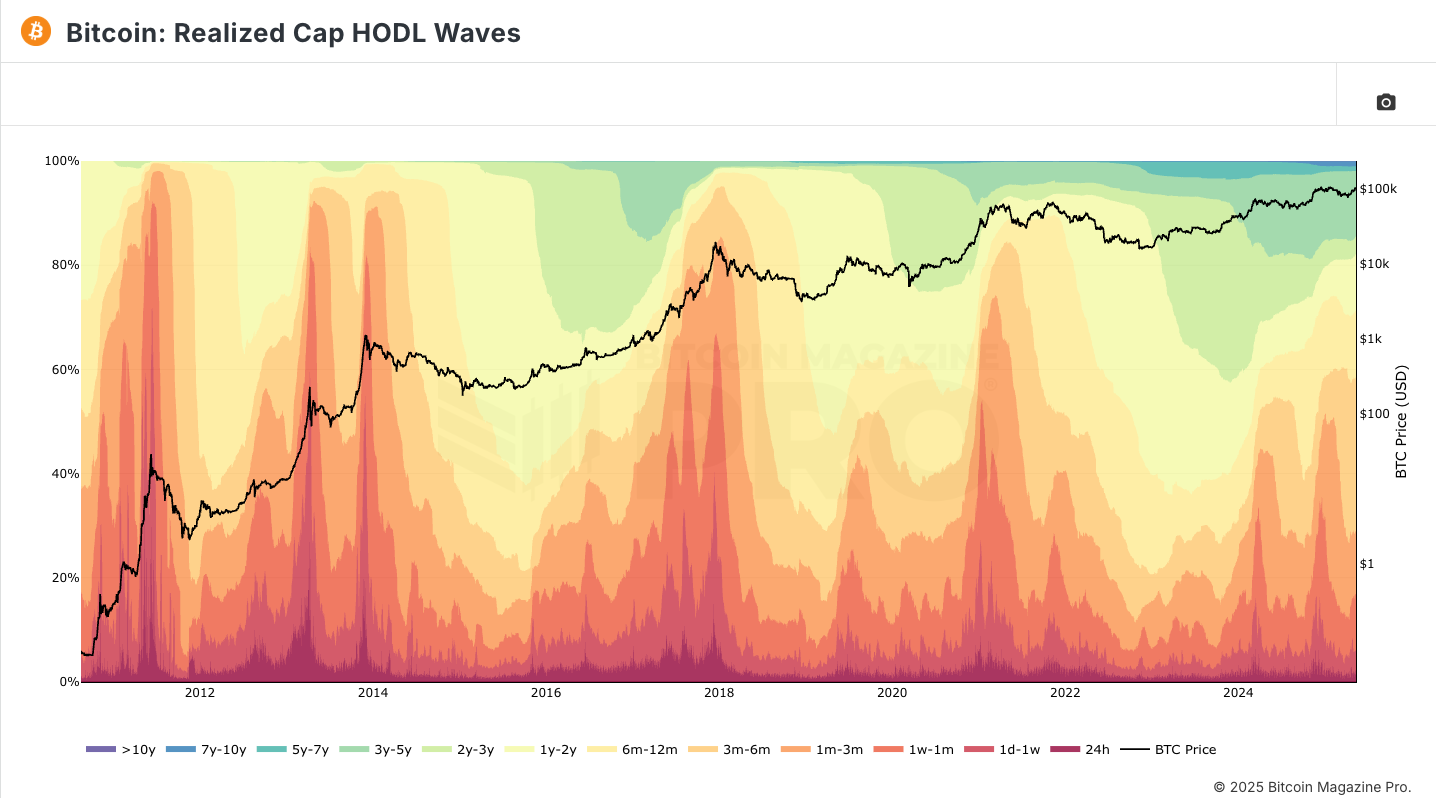
Source: BitcoinMagazine
Meanwhile, the MVRV Z-Score, a popular indicator comparing market value to realized value, is currently hovering around 4.3 – well below the overheated threshold above 7 seen in previous cycle tops. This implies that while BTC is certainly not undervalued, it’s also not exhibiting the euphoric overextension characteristic of a blow-off top.
Technical Analysis: Price Structure Suggests $120K–$140K as Next Targets
From a technical standpoint, Bitcoin recently broke out of a consolidation range between $86,000 and $97,000. This range had acted as resistance since the March top, and the breakout on May 10, accompanied by strong volume, suggests the next leg higher has begun.
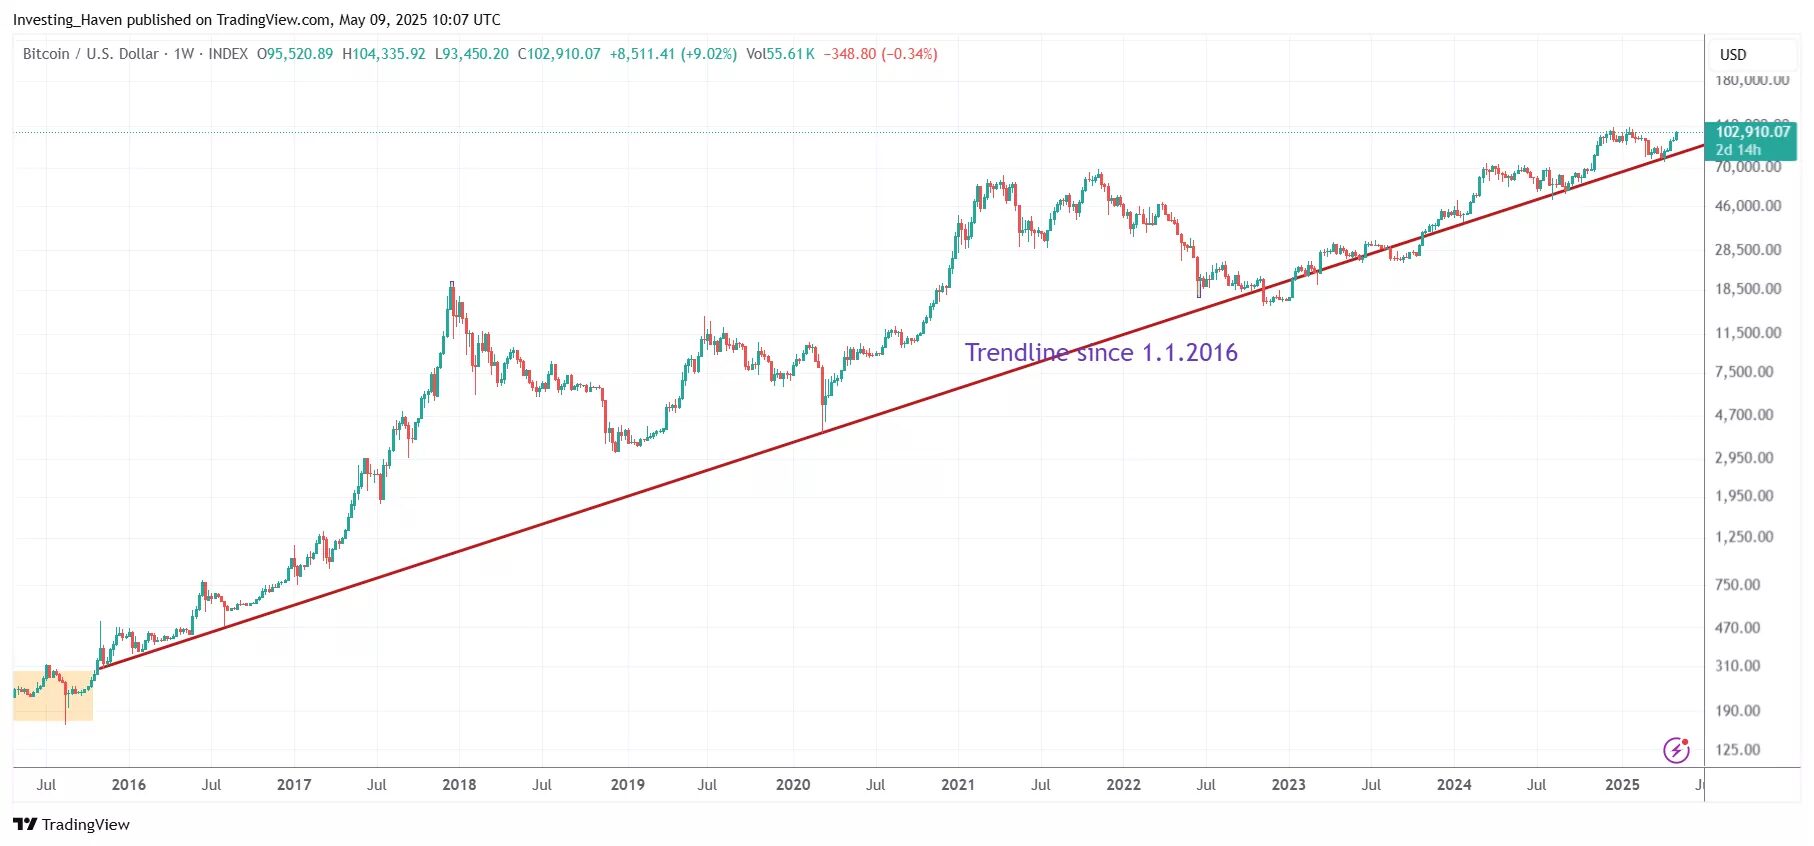
Source: TradingView
According to pseudonymous trader Rekt Capital, the breakout confirms a continuation pattern that resembles the 2017 cycle post-halving surge:
“The consolidation structure mirrors what we saw in May 2017. If the fractal plays out similarly, $120K is the next resistance zone before BTC tests the $140K area.”
Fibonacci extension levels from the November 2022 bottom ($15,600) to the March 2024 high ($73,800) place the 1.618 extension near $128,000 – a historically reliable target in parabolic cycles.
CoinCodex’s algorithmic models also suggest Bitcoin may rise toward $151,000 by November 2025, despite a potential 12.35% pullback in the short term.
Macro Conditions: Tailwinds, But Fragile
The U.S. Federal Reserve is expected to begin cutting rates in Q3 2025, with the CME FedWatch Tool pricing in a 75% probability of a 25bps cut at the September meeting. Lower interest rates tend to benefit risk assets, including Bitcoin.
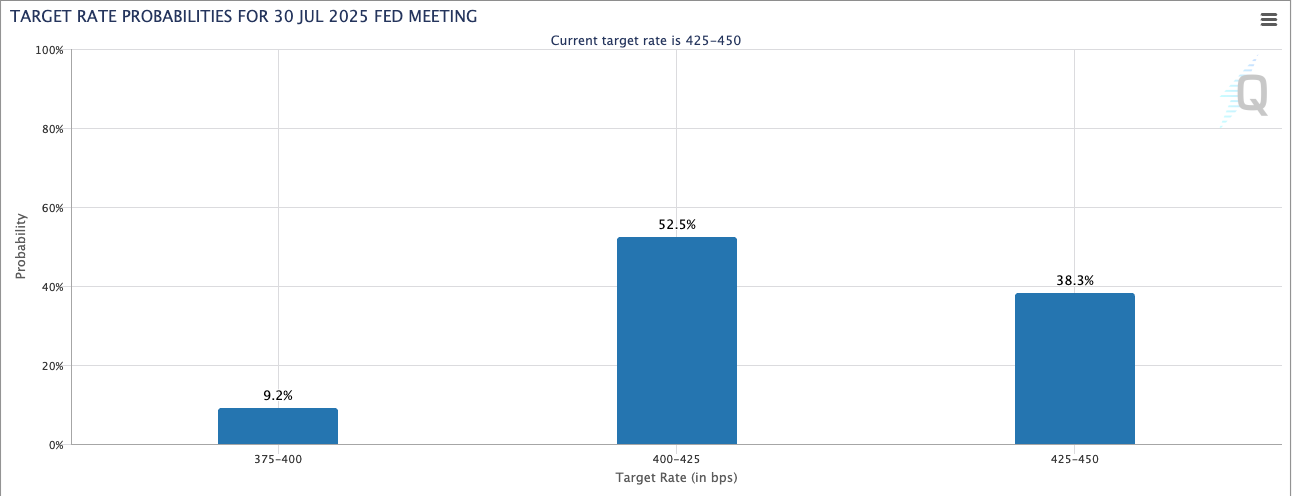
Source: CME Group
Additionally, gold’s recent surge to $2,550 per ounce, driven by central bank buying and global geopolitical instability, has renewed the narrative of Bitcoin as “digital gold.” In this climate, Bitcoin’s capped supply and resistance to inflation make it an attractive hedge.
However, tail risks remain. A sudden reversal in ETF flows, tightening liquidity from Asia (particularly Hong Kong and Singapore), or U.S. regulatory crackdowns could all threaten bullish momentum. Some experts also warn that if the U.S. or EU impose strict taxation policies on crypto capital gains, or if China intensifies restrictions on stablecoin flows, it could create negative sentiment globally.
Sentiment from Crypto Twitter and Traders
Influencers like CryptoKaleo and TheFlowHorse have suggested that BTC could hit between $135,000 and $160,000 before this cycle concludes, citing both macro and on-chain support. Anbessa100, a TA-focused account with over 300,000 followers, stated:
“As long as we hold $98K as support, the bullish structure remains intact. There’s a high probability BTC sees a final thrust toward $140K before topping.”
However, derivatives data from Coinglass shows funding rates exceeding +0.15% on several major exchanges, and long/short ratios above 68% – signs of overheated leverage that could trigger liquidations if price sharply reverses.
Comparing Past Cycles
Historically, Bitcoin has peaked 12–18 months after each halving. With the most recent halving occurring in April 2024, many analysts believe the peak could arrive between Q2 and Q4 of 2025.
In 2013, BTC surged ~10x post-halving; in 2017, the rally was ~20x; and in 2021, around ~6x. From the $15,600 bottom in 2022, a 6x move would place the cycle top at approximately $93,600 – already surpassed. A 10x move would imply $156,000.
Still, this cycle has unique characteristics: ETF inflows, increasing nation-state interest (e.g., Argentina legalizing BTC as a payment method), and an accelerating DeFi layer on Bitcoin (e.g., Runes, Ordinals, and Layer 2s).
DeFi protocols like Stacks, Bison Labs, and new Ordinals-based financial apps are turning Bitcoin into more than a store of value, potentially boosting demand for the asset itself.
Retail FOMO: Hasn’t Peaked Yet
Google Trends data for “buy Bitcoin” is at 41% of its all-time high in May 2021, suggesting retail frenzy hasn’t fully returned. Likewise, Coinbase’s app is only ranked #27 in the U.S. App Store Finance category, far below its #1 peak in April 2021.
Read more: Trading with Free Crypto Signals in Evening Trader Channel
These signals hint that BTC may still have room for one final leg up – the phase often driven by retail speculation and media euphoria.
However, the lack of retail-driven signals could also be interpreted in a more cautious light: Bitcoin’s rally may not yet be strong enough to sustain itself without broader participation.
Historically, the final parabolic leg of a bull market is accompanied by a surge in retail euphoria and a spike in search interest, neither of which has materialized in full. This raises the possibility that BTC could face a sharp correction before any true blow-off top occurs. When expectations run ahead of actual inflows, the market often sees a shakeout to flush out excess leverage and reset support levels.
Conclusion
There is no consensus answer. But based on current data, the majority of realistic projections – discounting moonshot predictions like $500K, cluster around $120K to $160K.
If ETF flows remain strong, macro conditions stay favorable, and retail euphoria kicks in, a peak between $140K and $150K seems plausible. However, traders should remain alert to signs of overheating, such as MVRV over 7, parabolic RSI moves, or excessive leverage in futures markets.