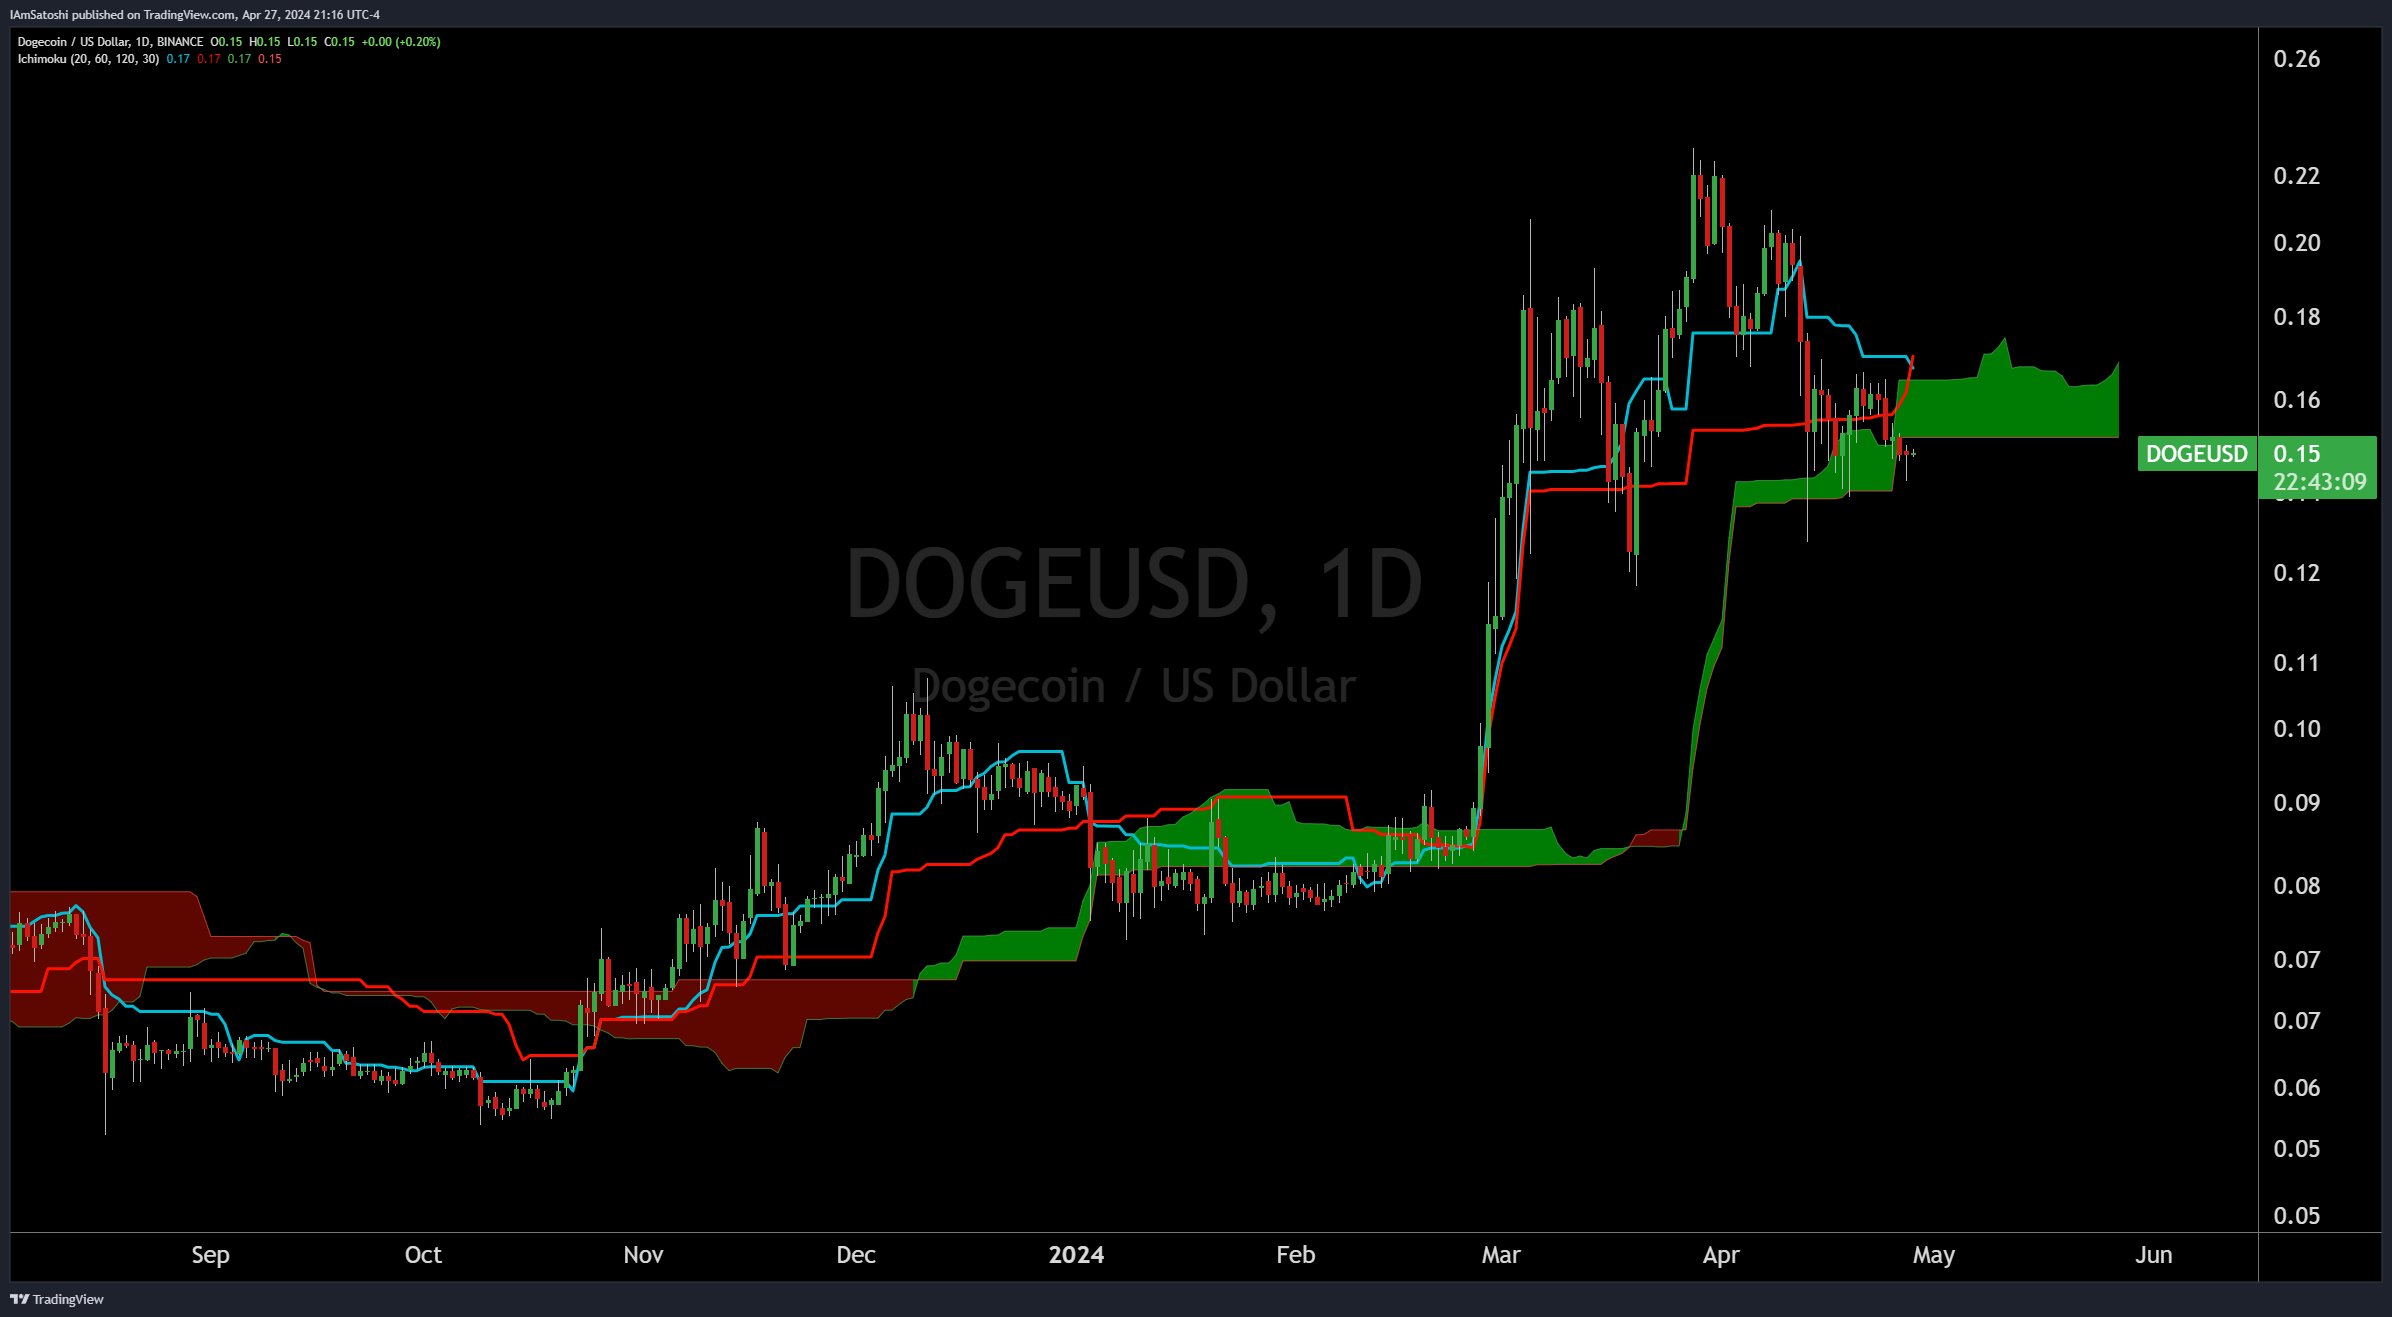
Crypto analyst Josh Olszewicz is once again warning of a looming Dogecoin price crash. The analysis hinges on the Ichimoku Cloud, a comprehensive indicator that provides information on support/resistance levels, momentum, and trend direction. Olszewicz’s analysis points to two specific technical phenomena on the 1-day (1D) chart of DOGE against the US dollar (DOGE/USD). Via X, he remarked “1D DOGE: bearish TK cross + bearish Kumo breakout.
Bearish Signals For Dogecoin
The bearish TK cross refers to the bearish crossover between the Tenkan-Sen (conversion line) and the Kijun-Sen (baseline) within the Ichimoku Cloud system.

The Tenkan-Sen, which is a faster-moving line typically calculated as the midpoint of the highest high and lowest low over the last nine periods, crossing below the Kijun-Sen, a slower line computed as the midpoint of the highest high and the lowest low over the past 26 periods, is considered a bearish signal.
It suggests that short-term prices are falling below the base level of prices over the last month, indicating potential further downward movement.
The Bearish Kumo breakout: The ‘Kumo’, which translates to ‘cloud’, is part of the Ichimoku Cloud indicator and is formed between two other lines: the Senkou Span A and the Senkou Span B. It represents a key area on the chart that can act as support or resistance.
In the context of Olszewicz’s analysis, a ‘bearish Kumo breakout’ implies that the price has broken through the cloud downwards. This breakout is seen as a confirmation of a bearish trend. The fact that the price is below the Kumo suggests that the overall market sentiment for DOGE is negative, with the Kumo now likely acting as resistance to any upward price movement.
The chart by Olszewicz shows DOGE trading at $0.15 with the cloud plotted behind the price action, appearing green above and red below the price lines. The cloud turning green represents a bullish future potential, but the price below both the cloud and the Tenkan-Sen/Kijun-Sen crossover indicates bearish current circumstances.
A 40% Price Crash Looming?
This gives weight to Olszewicz previous DOGE price analysis. As NewsBTC reported, the crypto analyst warned of a potential Head and Shoulders (H&S) formation on the DOGE/USD 12-hour chart which could be validated soon.
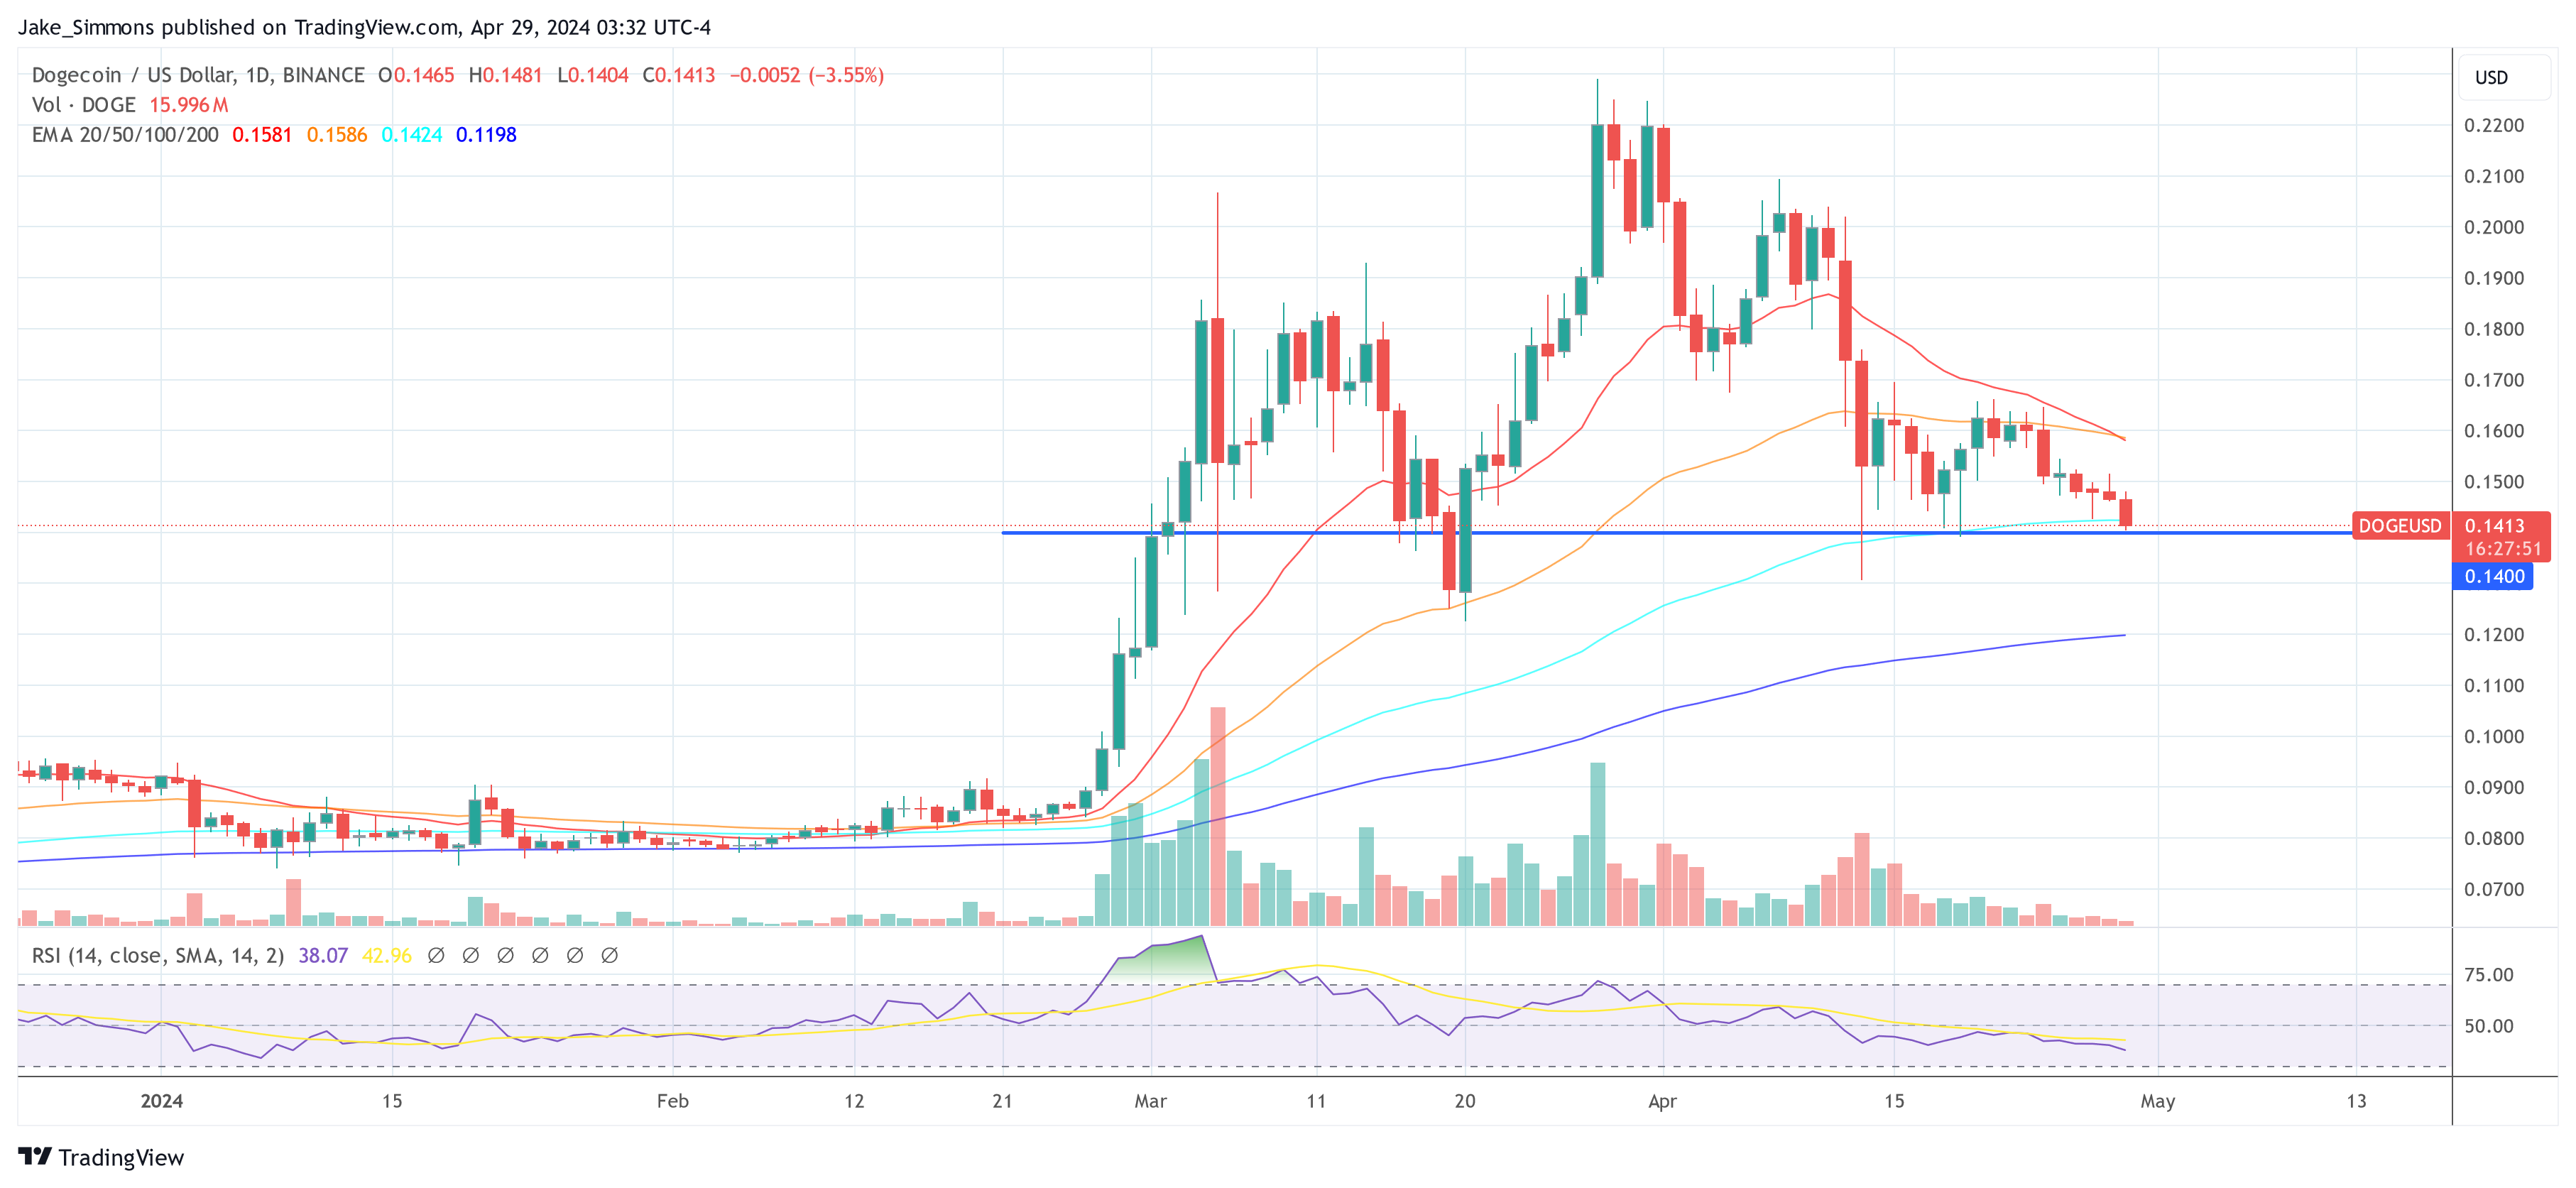
The formation is characterized by two shoulders flanking a distinctive head, with the neckline at approximately $0.14 being pivotal. Should Dogecoin’s price break below this critical support, the prophecy of the H&S pattern would likely manifest, potentially triggering a sell-off towards the $0.10 to $0.09 region.
This target area aligns with the 1.618 and 2.0 Fibonacci extension levels, suggesting a price crash of around 40% from the neckline. While the pattern has not yet been confirmed, with the price still above the crucial $0.14 support level, its presence serves as a cautionary signal to the market.
The technical confluence of the bearish TK cross and the bearish Kumo breakout in Olszewicz’s recent analysis only reinforces the possible bearish scenario that lies ahead for Dogecoin. Market participants are recommended to keep a close watch on the $0.14 level, as a decisive break below could validate the bearish outlook and set the stage for the anticipated decline.
At press time, DOGE traded at $0.1413.

Featured image created with DALL·E, chart from TradingView.com
Disclaimer: The article is provided for educational purposes only. It does not represent the opinions of NewsBTC on whether to buy, sell or hold any investments and naturally investing carries risks. You are advised to conduct your own research before making any investment decisions. Use information provided on this website entirely at your own risk.
 Bitcoin
  Ethereum
  Tether
  XRP
XRP  Solana
  USDC
USDC  TRON
TRON  Lido Staked Ether
  Dogecoin
  Figure Heloc
  Cardano
  Bitcoin Cash
  Wrapped stETH
  WhiteBIT Coin
  Wrapped Bitcoin
  Wrapped eETH
  USDS
USDS  Chainlink
  Binance Bridged USDT (BNB Smart Chain)
  Monero
  LEO Token
  WETH
WETH  Stellar
  Coinbase Wrapped BTC
  Sui
Sui  Ethena USDe
  Zcash
Zcash  Litecoin
  Avalanche
  Hyperliquid
  Shiba Inu
  Hedera
  Canton
  USDT0
USDT0  sUSDS
sUSDS  World Liberty Financial
  Dai
Dai  Toncoin
  Cronos
  Ethena Staked USDe
  PayPal USD
  Uniswap
  Polkadot
  USD1
USD1  Mantle
  Rain
Rain  MemeCore
  Bittensor


