On-chain data shows the smallest of the Bitcoin investors, the shrimps, have been selling recently. Here’s what it could mean for the coin.
Bitcoin Total Amount Of Holders Go Down As Retail Investors Exit
According to data from the on-chain analytics firm Santiment, the Total Amount Of Holders metric has registered a decline recently. This indicator keeps track of the total number of addresses on the blockchain that are currently carrying some non-zero balance.
When the value of this metric trends up, it can be a potential sign that adoption of the cryptocurrency is spreading right now. On the other hand, a drop in its value suggests some investors have decided to exit from the asset has they are completely clearing out their wallets.
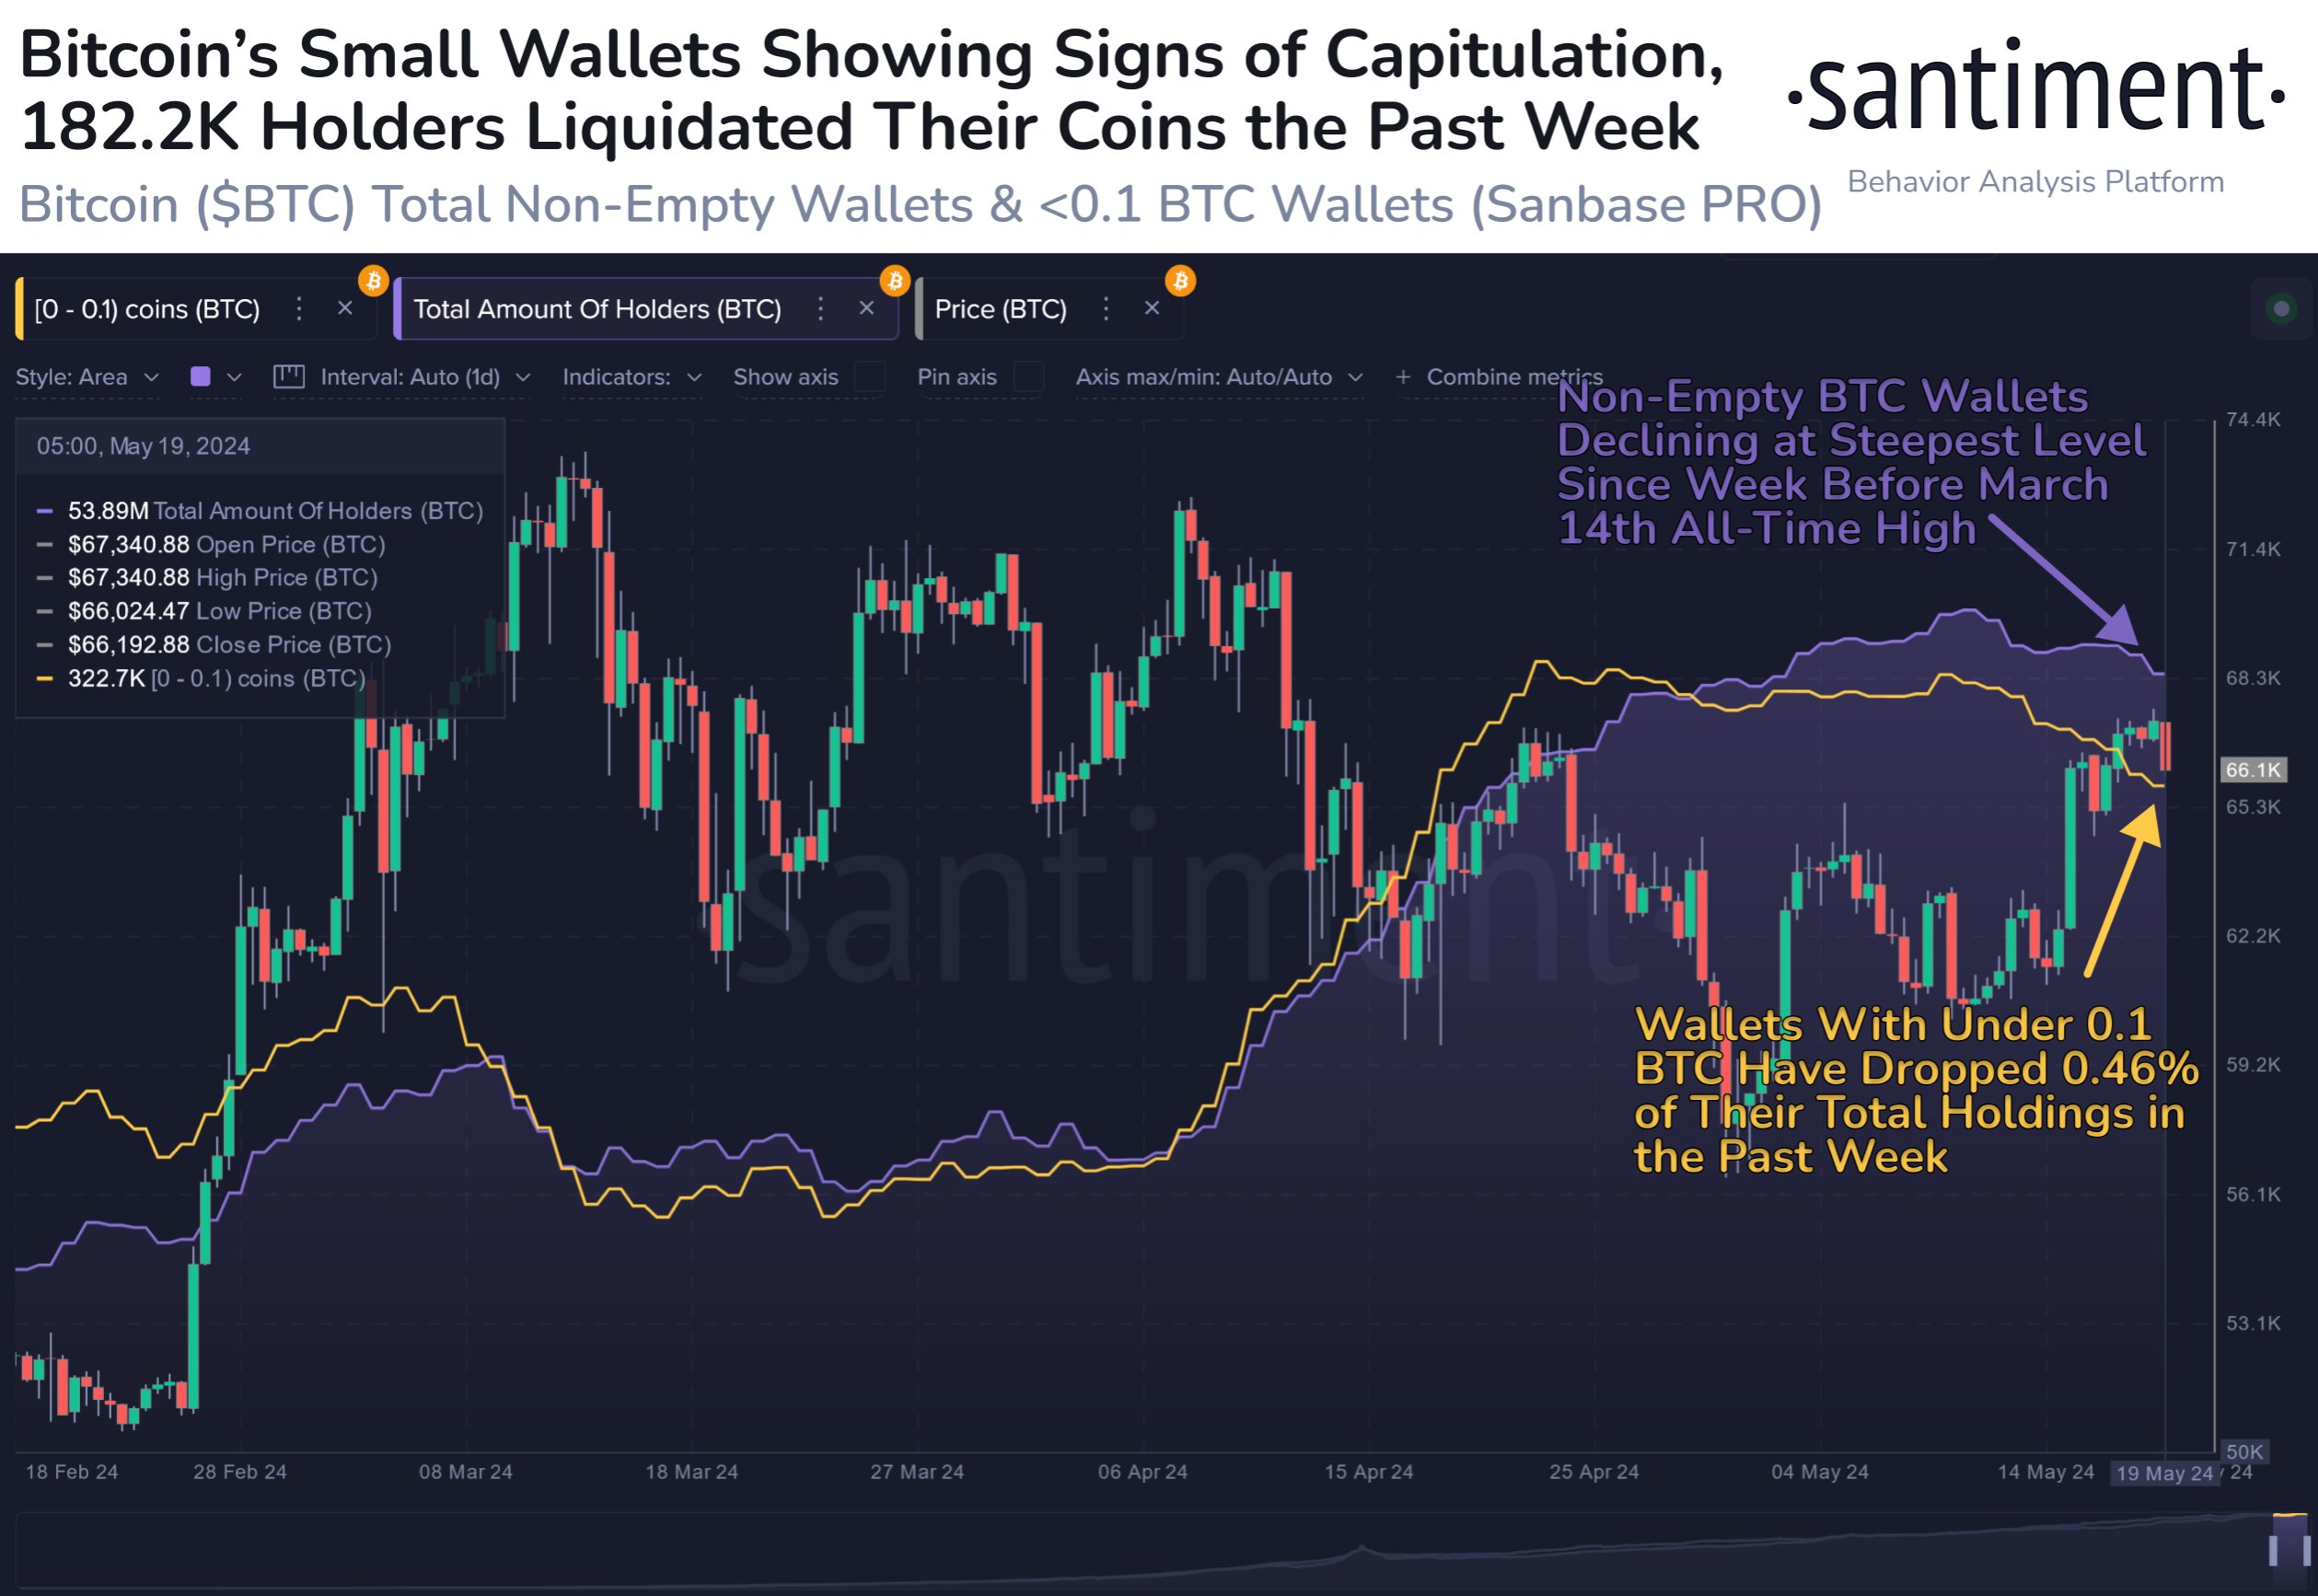
Now, here is a chart that shows the trend in the Bitcoin Total Amount Of Holders over the last few months:
Looks like the value of the metric has been going down in recent weeks | Source: Santiment on X
As displayed in the above graph, the Bitcoin Total Amount Of Holders has been observing a drawdown recently, implying a net number of investors have been leaving the cryptocurrency.
The latest drawdown in this metric is the steepest it has been since the all-time high (ATH) back in March. It’s possible that the latest recovery above $67,000 is what has enticed these holders into selling.
In the same chart, Santiment has also attached the data for the total amount of Bitcoin supply held by the investors carrying less than 0.1 BTC in their wallets. Such small holders represent a part of the retail investors and are popularly known as the shrimps.
From the graph, it’s visible that the combined holdings of the BTC shrimps has gone down recently, with these small entities offloading 0.46% of their coins in just the past week.
Interestingly, this decline has come alongside the drawdown in the Total Amount of Holders, so it would appear possible that the ones liquidating their wallets have in fact been these small hands.
The retail investors may be thinking that the current price recovery isn’t going to last long, so they could be exiting while they still can at these relatively high prices. The larger entities in the market like the sharks and whales would potentially be picking up these coins, thus growing their holdings even larger.
“Historically, small wallets dumping their coins to larger wallets is an encouraging and bullish sign for BTC,” notes the analytics firm. It now remains to be seen whether this latest trend will indeed end up becoming the bullish spark the asset requires or not.
BTC Price
Bitcoin’s latest surge has meant that the cryptocurrency’s price has now surpassed the $67,000 level for the first time in almost a month. The last time a recovery above this level took place, BTC lost its bullish momentum before long. It’s uncertain whether a similar fate awaits BTC this time as well.
The price of the asset appears to have surged over the past few days | Source: BTCUSD on TradingView
Featured image from Erling Løken Andersen on Unsplash.com, Santiment.net, chart from TradingView.com
 Bitcoin
  Ethereum
  Tether
  XRP
XRP  USDC
USDC  JUSD
JUSD  Lido Staked Ether
  TRON
TRON  Dogecoin
  Figure Heloc
  Cardano
  Wrapped stETH
  Bitcoin Cash
  WhiteBIT Coin
  Wrapped Bitcoin
  Wrapped eETH
  USDS
USDS  Binance Bridged USDT (BNB Smart Chain)
  Monero
  Chainlink
  LEO Token
  Hyperliquid
  Coinbase Wrapped BTC
  WETH
WETH  Stellar
  Ethena USDe
  Zcash
Zcash  Canton
  Sui
Sui  Litecoin
  Avalanche
  USD1
USD1  Shiba Inu
  Hedera
  World Liberty Financial
  USDT0
USDT0  Dai
Dai  sUSDS
sUSDS  PayPal USD
  Ethena Staked USDe
  Toncoin
  Cronos
  Rain
Rain  Polkadot
  Uniswap
  Mantle
  MemeCore
  Tether Gold


